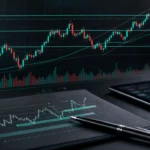
Bitcoin has recently retreated below the $65,556 resistance level, signaling a shift in momentum that has drawn significant attention from active market participants. This price action marks a critical juncture for digital assets as buyers struggle to maintain the bullish structure established over the previous sessions, leading to a consolidation phase that is currently testing the resolve of short-term momentum traders.
For investors, this shift is essential to track because it highlights the fragility of current support zones in a landscape characterized by fluctuating liquidity. As the asset orbits these technical thresholds, the inability to reclaim and hold above the $65,556 mark increases the probability of a broader retest of lower demand zones. Understanding the mechanics behind this squeeze is vital for navigating the risk-reward profiles currently present in the cryptocurrency sector.
Key Market Drivers
The primary driver behind the current price action remains the interplay between supply overhang and institutional liquidity. The struggle at $65,556 reflects a heavy concentration of sell orders that have effectively capped upside potential, causing a cooling-off period in broader digital asset sentiment. Markets are currently navigating a environment where technical resistance is acting as a psychological ceiling, prompting traders to pause and re-evaluate their exposure to risk-on assets.
Macroeconomic sentiment continues to exert a heavy hand on crypto flows. As global markets monitor central bank rhetoric and shifting yield expectations, the appetite for speculative capital has ebbed, placing Bitcoin in a defensive posture. The recent failure to sustain a breakout suggests that liquidity is currently being sidelined, waiting for a clearer catalyst—whether regulatory, fiscal, or monetary—to break the prevailing stagnation.
Trader Takeaways
- Monitor the $65,556 level as the primary pivot point for trend resumption. A failure to consolidate above this figure suggests continued bearish pressure.
- Prioritize risk management by adjusting stop-loss orders to account for increased volatility as the price tests proximity to major resistance.
- Assess volume profiles during these squeeze events; low-volume pullbacks often lack the conviction required for a sustained trend reversal.
- Maintain a focus on short-term mean reversion strategies, as the market currently displays a high degree of sensitivity to mean-price oscillations.
- Reduce leverage during periods of indecision; sideways price action around key technical levels often leads to liquidity spikes that trigger stop-runs in both directions.
Levels and Signals to Watch
The immediate focus for technical analysts is the $65,556 resistance level. Confirmation of a bullish breakout would require not just a price touch, but a sustained hourly or daily close above this barrier backed by an uptick in trade volume. Conversely, invalidation of the current bullish thesis occurs if the asset fails to stabilize, signaling a potential move toward liquidity pockets situated below current support levels.
Momentum indicators are showing signs of exhaustion, indicating that the market is in a wait-and-see mode. Traders should monitor volatility bands, as a contraction typically precedes an expansion move. If the asset cannot regain its footing, the risk of a sharp downside correction increases, particularly if stop-loss orders below support are triggered, leading to a cascade of selling.
Cross-Asset Context
Bitcoin’s current performance is intrinsically linked to the broader risk-on environment observed across global equities and commodity markets. When the U.S. Dollar Index (DXY) shows strength, crypto assets often face reciprocal pressure, as capital flows back into safer yield-bearing instruments. Traders should observe how Bitcoin correlates with major stock indices during this squeeze; if crypto continues to lag while equities push higher, it may indicate a specific decoupling that suggests internal weakness within the digital asset market rather than a macro-driven phenomenon.