
Key takeaways
- Yen weakness persists despite intervention risks: USD/JPY surged to a 21-month high above 160.45, brushing off verbal intervention warnings as bullish momentum remains firmly intact.
- Macro drivers favour further upside: Rising oil prices and a widening US–Japan rate differential (Fed more hawkish vs BoJ’s gradual stance) continue to pressure the yen, reinforcing USD/JPY’s uptrend.
- Technical structure supports continuation: Price action remains within a rising channel above 159.85 support, with momentum indicators signalling further upside potential toward 161.16 and beyond unless a breakdown triggers a pullback.
The Japanese yen had staged a mild gain of 0.5% to print a 5-day high of 158.96 per US dollar ex-post the Bank of Japan’s (BoJ) monetary policy meeting on Tuesday, 28 April 2026.
BoJ advocated a “hawkish hold” on its cash policy rate at 0.75%, with three officials dissenting (opting for a rate hike), which represented the biggest divide under Ueda’s governorship.
Overall, the BoJ has continued to guide the market along the lines of its “gradual interest rate hike” stance; in turn, short-term interest rate swaps traders are pricing a 66% chance that the BoJ may enact an interest rate hike when it sets policy again on 16 June 2026.
However, the gains on the yen were short-lived despite recent “stark and forceful” verbal intervention remarks made by Japan’s Finance Minister Katayama on 23 April and 28 April, expressing concerns on a weakening yen with authorities standing ready to respond as needed to move in the currency market around the clock.
Higher oil prices and hawkish dissents in the Fed ignite another rout in JPY
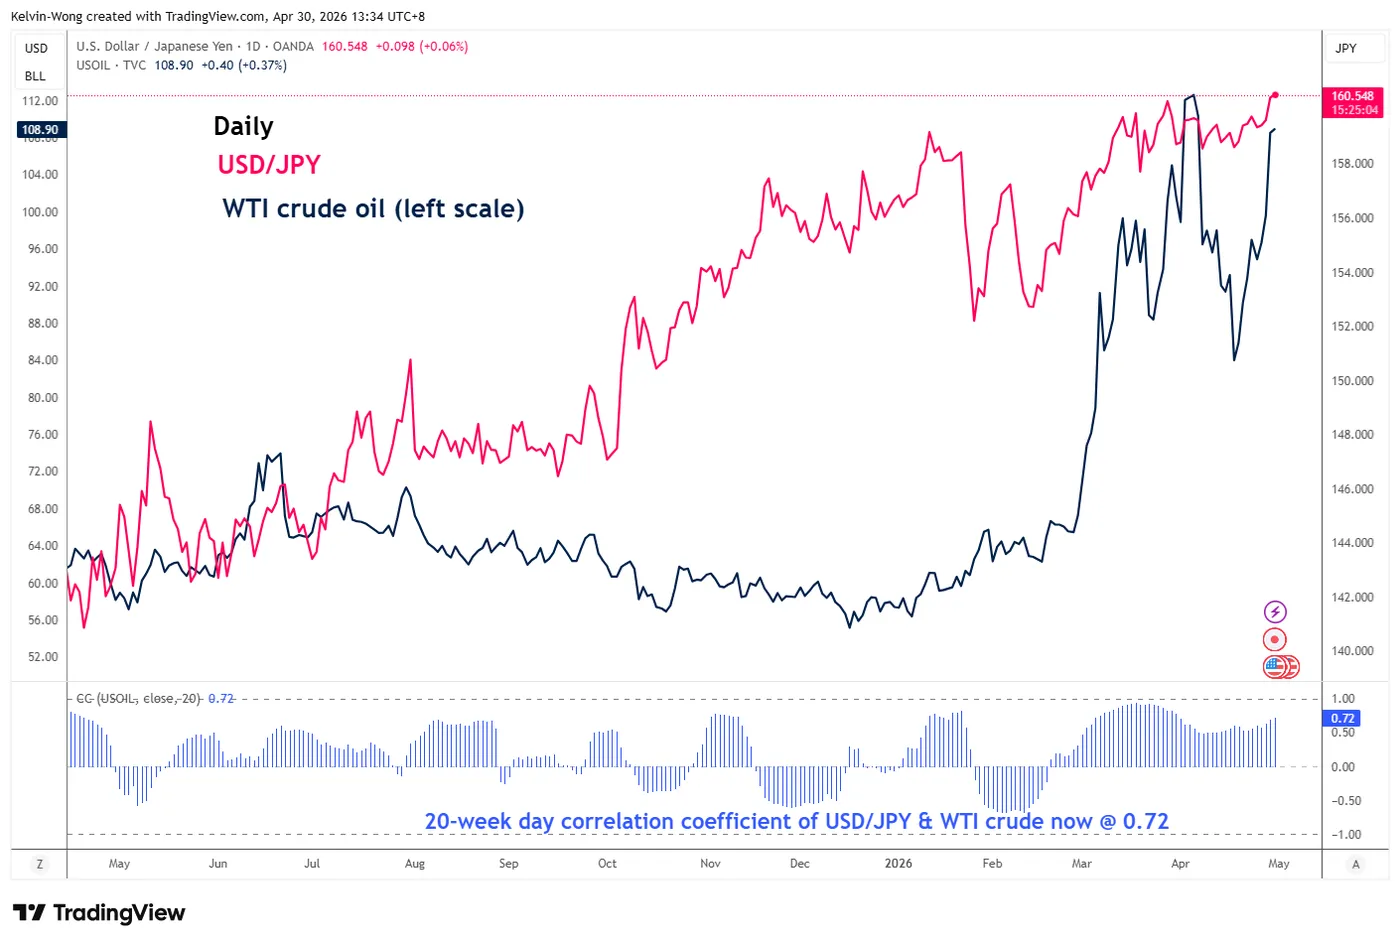
Fig. 1: Medium-term trends of USD/JPY & WTI crude oil with correlation coefficient as of 30 Apr 2026 (Source: TradingView).
The movement of the USD/JPY has a significant direct correlation with WTI crude. They move in tandem as Japan imports approximately 95% of its crude oil from the Middle East, and oil fuels Japan’s key export-oriented sectors like automotive and manufacturing.
Hence, without any clear signs from the US and Iran to reopen the Strait of Hormuz, a critical waterway for global oil and energy flows, it increases the risk of stagflation in Japan, putting the BoJ in a dilemma to maintain its “gradual interest rate hike” monetary policy stance (a negative for the JPY).
The WTI crude oil has rallied by 38% since 17 April 2026 to trade at an intraday level of $110/barrel at this time of writing, erasing its losses since the start of the US-Iran ceasefire agreement on 7 April.
The recent hawkish messaging from the US White House administration towards Iran, continuation of the US Navy blockage in the strait, Trump’s rejection of Iran’s latest proposal to reopen the waterway, and the latest report by Axios, today, that highlighted US military commanders are set to present President Trump with fresh options for military action against Iran on Thursday, 30 April.
Given that the USD/JPY has a high direction correlation of 0.72 (20-day rolling) with WTI crude oil, with the near-term bullish trend remaining intact for WTI crude oil (three consecutive daily closes above its 20-day moving average at $99.50/barrel), there is a high probability that the USD/JPY is likely to face further upside pressure in the near-term (see Fig. 1).
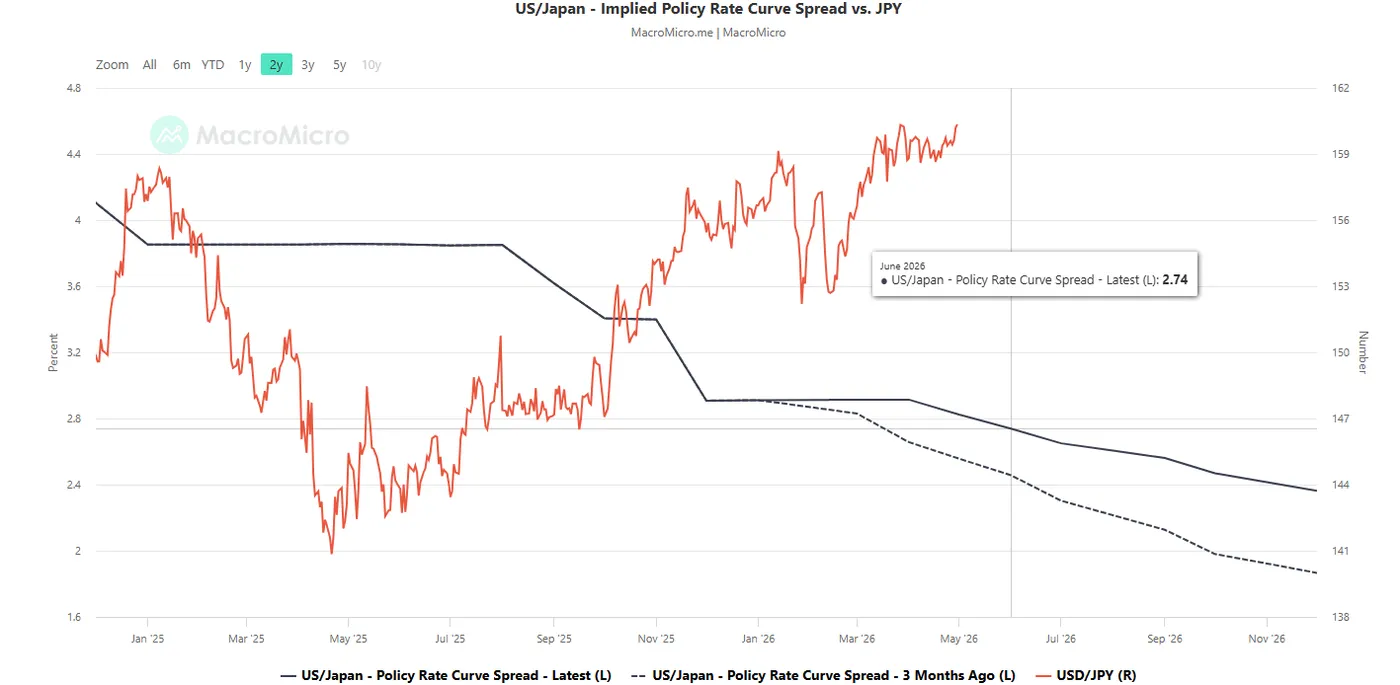
Fig. 2: US-Japan implied interest rate policy curve spread as of 29 Apr 2026 (Source: MacroMicro).
The monthly implied future policy interest rate curves for the US and Japan are calculated using short-term interest rate futures that are highly sensitive to the expectations on these countries’ central banks’ monetary policies (the Fed and BoJ, respectively.
The current US/Japan implied interest rate policy curve spread for June 2026 has flattened, but it has shifted upwards to 2.74% from 2.46% three months ago (see Fig. 2), reinforced by three US Federal Reserve officials who dissented against an “easing bias” in yesterday’s FOMC monetary policy statement.
These observations suggest that the Fed is likely to be more hawkish or less dovish than the BoJ, which may prevent the Japanese yen from altering its major downtrend phase against the US dollar in place since May 2025.
Let’s focus now on the short-term trajectory (1 to 3 days) of the USD/JPY from a technical analysis perspective.
USD/JPY – Rallied to a 21-month high and cleared above 160.45 “intervention level”
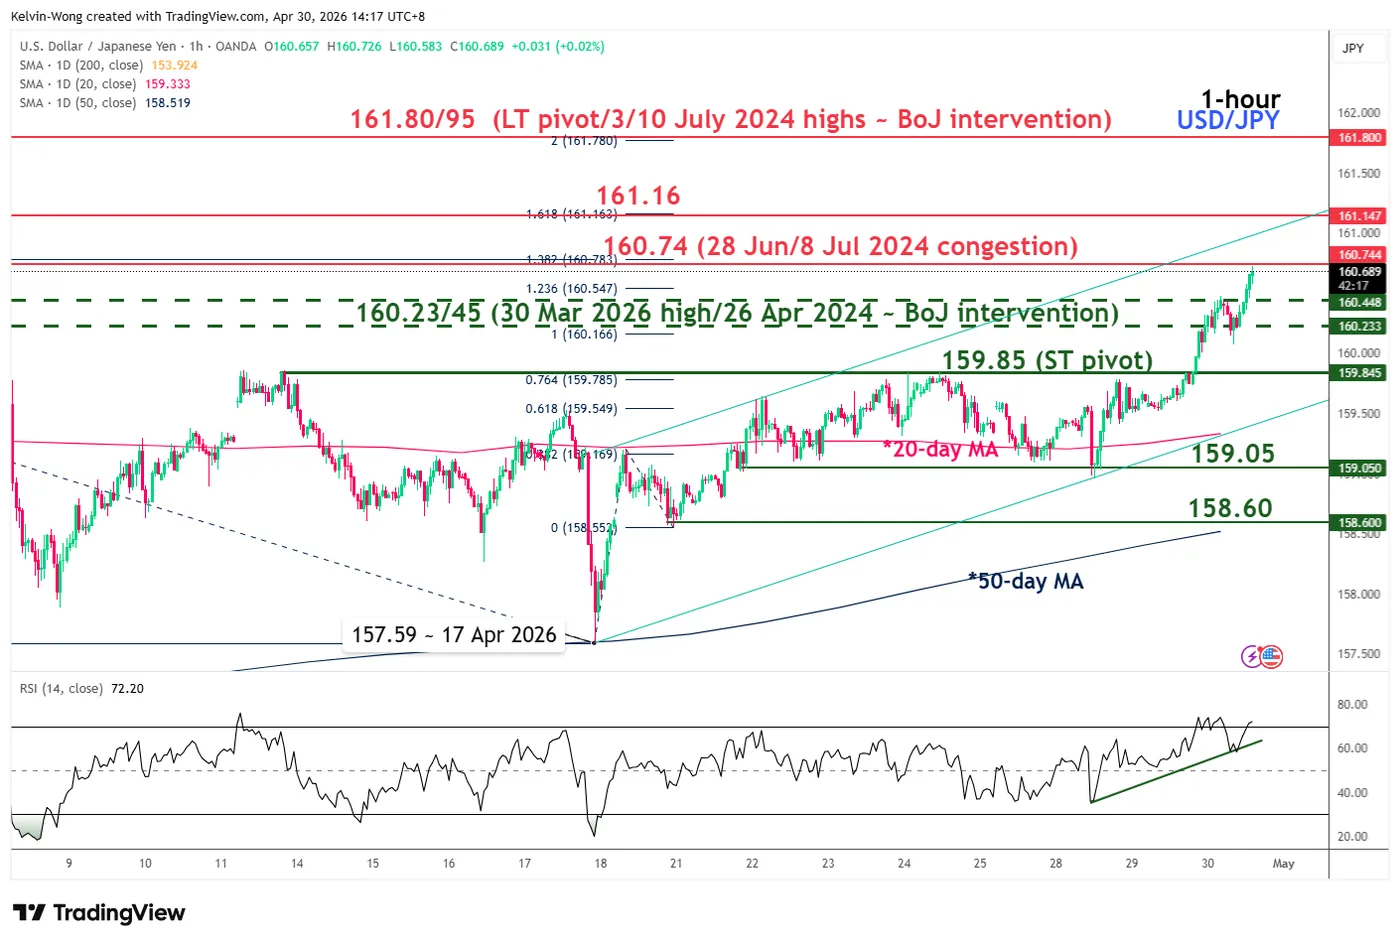
Fig. 3: USD/JPY minor trend as of 30 Apr 2026 (Source: TradingView).
The “red hot” USD/JPY has continued its climb upwards and hit a 21-month intraday high of 160.67, clearing above the prior intervention level zone of 160.23/45, where Japanese authorities stepped into the currency market on 26 April 2024.
Watch the 159.85 key short-term pivotal support on the USD/JPY to maintain its ongoing minor uptrend phase from 17 April 2026 low, with the next intermediate resistances coming in at 160.74 and 161.16 (also a Fibonacci extension) (see Fig. 3).
A clearance above 161.16 may see a further push up to test the 161.80/95 key long-term pivotal resistance, where prior intervention took place in early July 2024.
However, a bearish reversal and an hourly close below 159.85 invalidates the near-term bullish tone for a corrective pull-back to expose the next intermediate supports at 159.05 and 158.60 (also the 50-day moving average).
Key elements to support the near-term bullish bias on USD/JPY
- The price actions of the USD/JPY have continued to oscillate within a minor ascending channel since the 17 April 2026 low of 157.59, with its upper boundary at around 161.16.
- The hourly RSI momentum indicator has continued to flash out bullish momentum conditions as it printed a series of “higher lows” above the 50 level.