
Key takeaways
- GBP/USD remains supported despite renewed US-Iran tensions, with traders now closely focused on upcoming US labour market data and University of Michigan consumer sentiment figures that could drive near-term volatility in the pair.
- Intermarket dynamics favour further upside for sterling, as the UK-US implied interest rate spread has steepened significantly, reinforcing expectations that the Bank of England may stay relatively more hawkish than the Federal Reserve.
- Technical indicators suggest a potential bullish reversal is underway, with GBP/USD rebounding from its ascending channel support, holding above its 20-day and 50-day moving averages, while momentum indicators point to strengthening upside momentum above the 1.3530 support zone.
After the sterling hit a 2-month high of 1.3658 on 1 May 2026 against the US dollar, the GBP/USD has traded sideways, and on Thursday, 7 May 2026, it declined by 0.2% to print an intraday low of 1.1723 on the backdrop of an uptick in US-Iran tension after both sides exchanged fire.
In addition to the latest developments surrounding the US-Iran conflict, where markets are awaiting Iran’s response to Washington’s latest proposal to reopen the Strait of Hormuz, traders will also be closely watching several key US economic releases today that may influence the short-term direction of GBP/USD.
These include the April non-farm payrolls and unemployment rate data at 8:30 pm SGT, followed by the preliminary University of Michigan consumer sentiment report for May at 10:00 pm SGT.
Interestingly, intermarket and technical factors are now supporting a potential bullish reversal in the GBP/USD at this juncture.
Let’s unpack in greater detail.
The UK/US Implied Interest Rate Policy Curve Spread Has Steepened
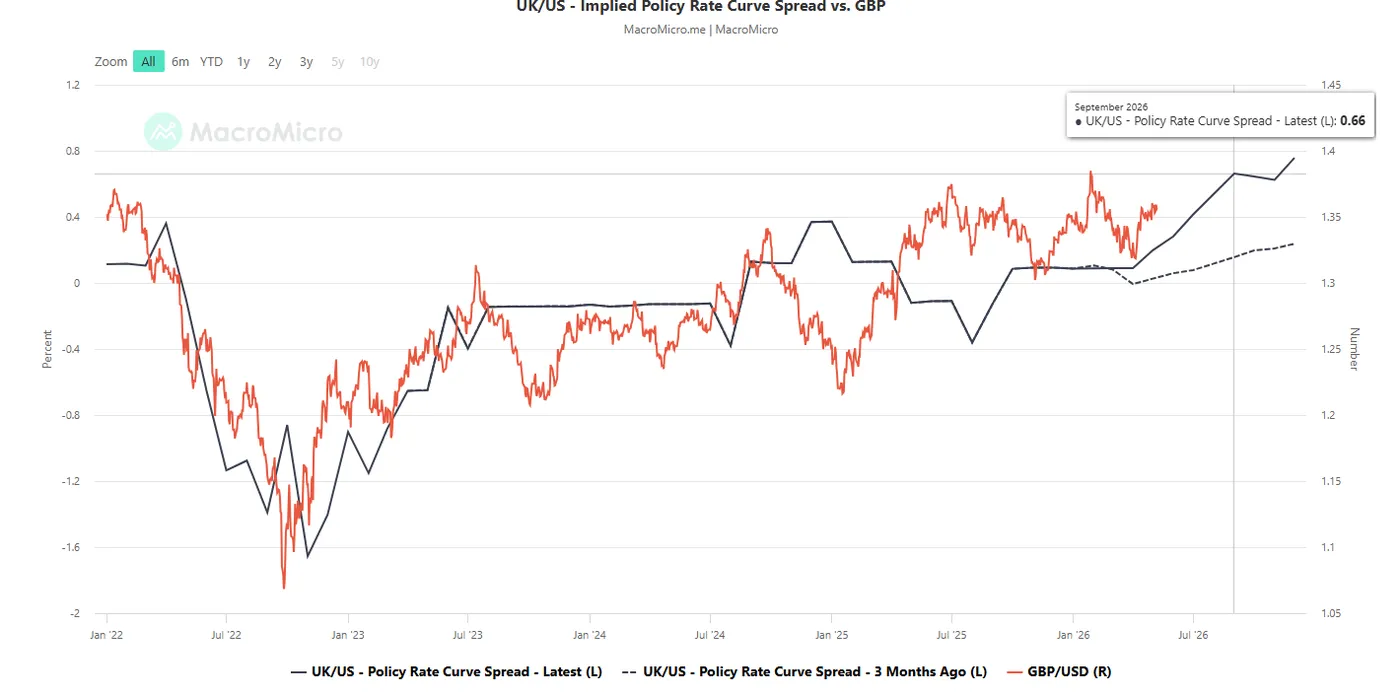
Fig. 1: UK-US implied interest rate policy curve spread as of 7 May 2026 (Source: MacroMicro).
Interest rate futures markets indicate that the Bank of England (BoE) will likely hike in July after being on hold at 3.75% since December 2025.
The current Eurozone/US implied interest rate policy curve spread for the period from June 2026 to September 2026 has steepened significantly.
In addition, the curve has also shifted upwards, with the current September 2026 reading standing at 0.66% compared to 0.16% three months ago (see Fig. 1).
These observations suggest that the BoE is likely to be less dovish or more hawkish than the Fed, which in turn could provide support for a potentially firmer GBP/USD.
The monthly implied future monetary policy interest rate curves for the UK and the US are calculated using short-term interest rate futures that are highly sensitive to the expectations on these countries’ central banks’ respective monetary policies.
Let’s focus now on the short-term trajectory (1 to 3 days) of the GBP/USD from a technical analysis perspective.
GBP/USD – Holding Above 1.3530, Watch the 1.3640/3665 Range Resistance Next
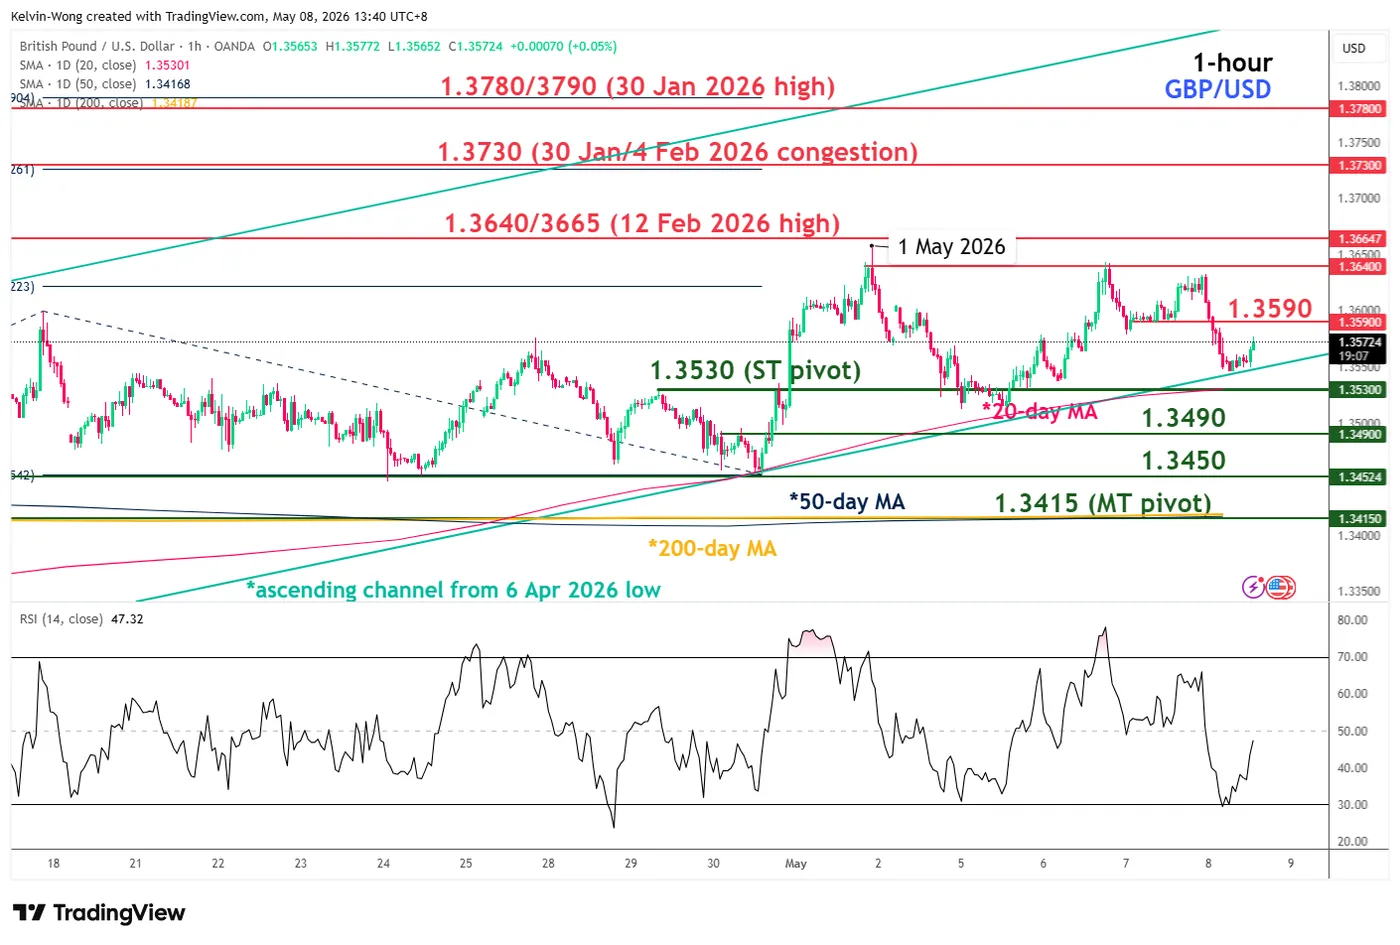
Fig. 2: GBP/USD minor trend as of 8 May 2026 (Source: TradingView).
Trend bias: Bullish above 1.3530 short-term pivotal support within an uptrend phase (see Fig. 2).
Resistances: 1.3590, 1.3640/3665 (upside trigger), and 1.3730
Next supports: 1.3490 and 1.3450
Key Elements to Support the Near-Term Bullish Bias on GBP/USD
- Price actions have managed to stage a rebound after a retest on the lower boundary of the medium-term ascending channel from the 6 April 2026 low.
- Price actions continue to trade above their 20-day and 50-day moving averages, which support an ongoing medium-term uptrend phase.
- The hourly RSI momentum indicator has just exited from its oversold region (below the 30 level) in today’s Asian session (Friday, 8 May 2026).