Key takeaways
- Nasdaq 100 remains in a bullish structure despite short-term volatility driven by US–Iran geopolitical tensions and profit-taking, with price action stabilising above key support at 28,280.
- Market sentiment was briefly pressured by conflict-related headlines, but losses were largely recovered as ceasefire stability expectations improved and risk appetite returned.
- Market breadth is healthy but not euphoric, with broad participation across components and technical indicators supporting near-term upside continuation.
The US stock market saw profit-taking on Thursday, 7 May 2026, as traders grew increasingly concerned over the fragility of the month-long US-Iran ceasefire after both sides exchanged fire.
Market sentiment was further unsettled by uncertainty surrounding Washington’s latest proposal to Iran to reopen the Strait of Hormuz, which Tehran has yet to respond to.
The leading Nasdaq 100 dropped by 1.3% intraday from its all-time intraday high of 28,825, but trimmed its losses to end Thursday’s US session with a marginal loss of only 0.1% and underperformed against other US stock indices; S&P 500 (-0.4%), Dow Jones Industrial Average (-0.6%), and small-cap Russell 2000 (-1.6%).
In today’s (Friday, 8 May 2026), the Nasdaq 100 E-min futures recovered by 0.5% at this time of writing and almost recovered Thursday’s US session losses, reinforced by US President Trump’s remarks that stated the ceasefire agreement “remains intact”.
Aside from this piece of “Trump’s positive news flow”, several technical elements are also advocating for another potential round of fresh short-term bullish impulsive up move sequence for the Nasdaq 100.
Let’s decipher them.
Nasdaq 100’s Market Breadth Remains Healthy, Not Euphoric
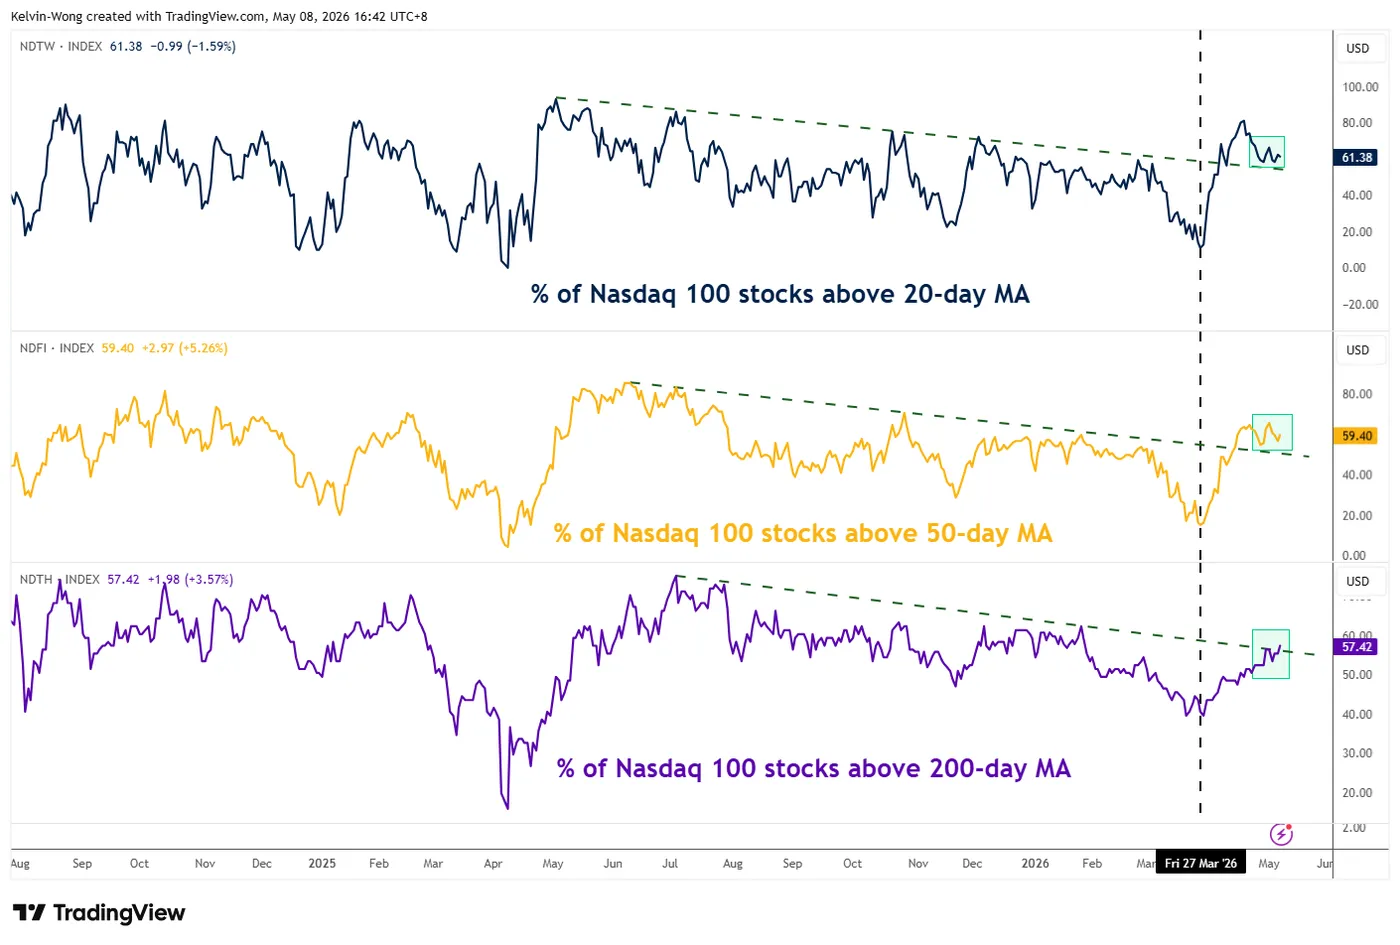
Fig. 1: Nasdaq 100 component stocks above 20-day, 50-day & 200-day moving averages as of 7 May 2026 (Source: TradingView).
Even though in the past four weeks, the performance of the Nasdaq 100 has been primarily driven by several AI-related semiconductors and chip stocks such as Intel (+111%), SanDisk (+87%), and Advanced Micro Devices (+87%), the percentage of Nasdaq 100 component stocks trading above their respective 20-day and 50-day moving averages is steady at 61% and 59%, not yet at euphoric levels of 80%-90%.
In addition, the percentage of Nasdaq 100 component stocks trading above the key 200-day moving averages has increased steadily from 47% on 15 April 2026 to 57% as of Thursday, 7 May 2026 (below euphoric levels of 80%-90%), which indicates that a broader set of Nasdaq 100 is taking part in this ongoing rally since the end of March 2026 (see Fig. 1).
Let’s now focus on the short-term trajectory (1 to 3 days) of the US Nasdaq 100 CFD index (a proxy of the Nasdaq 100 E-mini futures).
Nasdaq 100 – Looking to Break Above 28,890 with Bullish Momentum
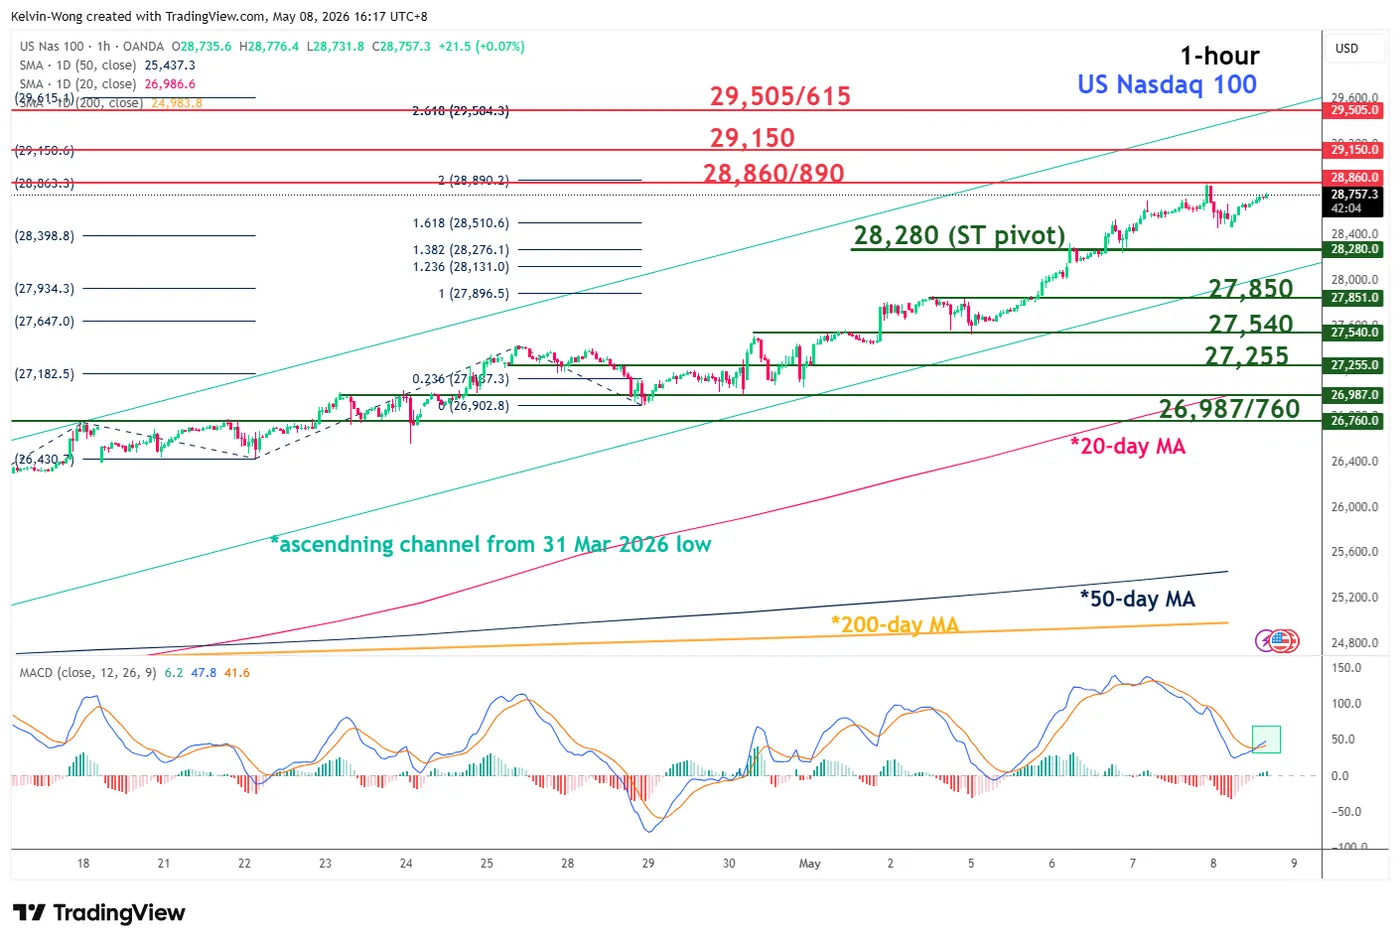
Fig. 2: US Nasdaq 100 CFD index minor trend as of 8 May 2026 (Source: TradingView).
Trend bias: Bullish above 28,280 short-term pivotal support within an uptrend phase (see Fig. 2).
Resistances: 28,860/890, 29,150, and 29,505/615
Next supports: 27,850, 27,540, and 27,255
Key Elements to Support the Near-Term Bullish Bias on the Nasdaq 100
- Price actions continue to oscillate within a medium-term ascending channel from the 31 March 2026 low.
- Current price actions of the Nasdaq 100 CFD index are trading at the upper half of the ascending channel, with the upper boundary of the channel coming in at around 29,505.
- The hourly MACD trend indicator has just flashed out a bullish crossover condition above its centreline.