In this technical blog, we will look at the past performance of the 1-hour Elliott Wave Charts of Botcoin ticker symbol: BTCUSD. In which, the rally from the 29 April 2026 low unfolded as an impulse structure. Showing a higher high sequence in larger time frame charts favored more upside extension to take place. Therefore, we advised members not to sell the pair & buy the dips in 3, 7, or 11 swings at the blue box areas. We will explain the structure & forecast below:
Bitcoin 1-Hour Elliott Wave Chart From 5.07.2026
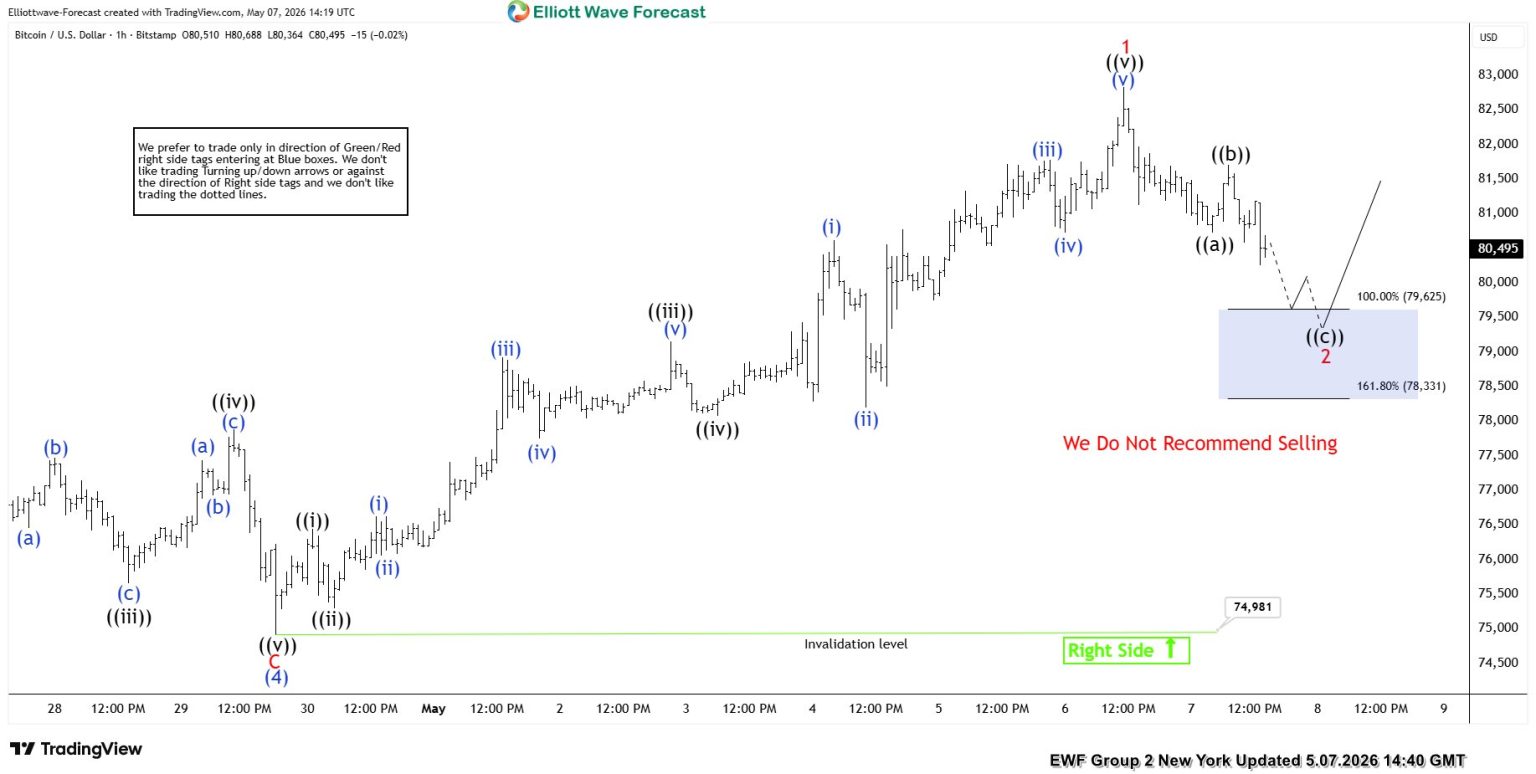
Here’s the 1-hour Elliott wave chart from the 5.07.2026 New York update. In which, the cycle from the 4.29.2026 low ended in wave 1 at $82833 high. Down from there, the BTCUSD made a pullback in wave 2 to correct that cycle. The internals of that pullback unfolded as Elliott wave zigzag structure where wave ((a)) ended at $80728 low. Wave ((b)) bounce ended at $81706 high and wave ((c)) managed to reach the blue box area at $79625- $78331. From there, buyers were expected to appear looking for the next leg higher or for a 3 wave bounce minimum.
Bitcoin Latest 1-Hour Elliott Wave Chart From 5.12.2026
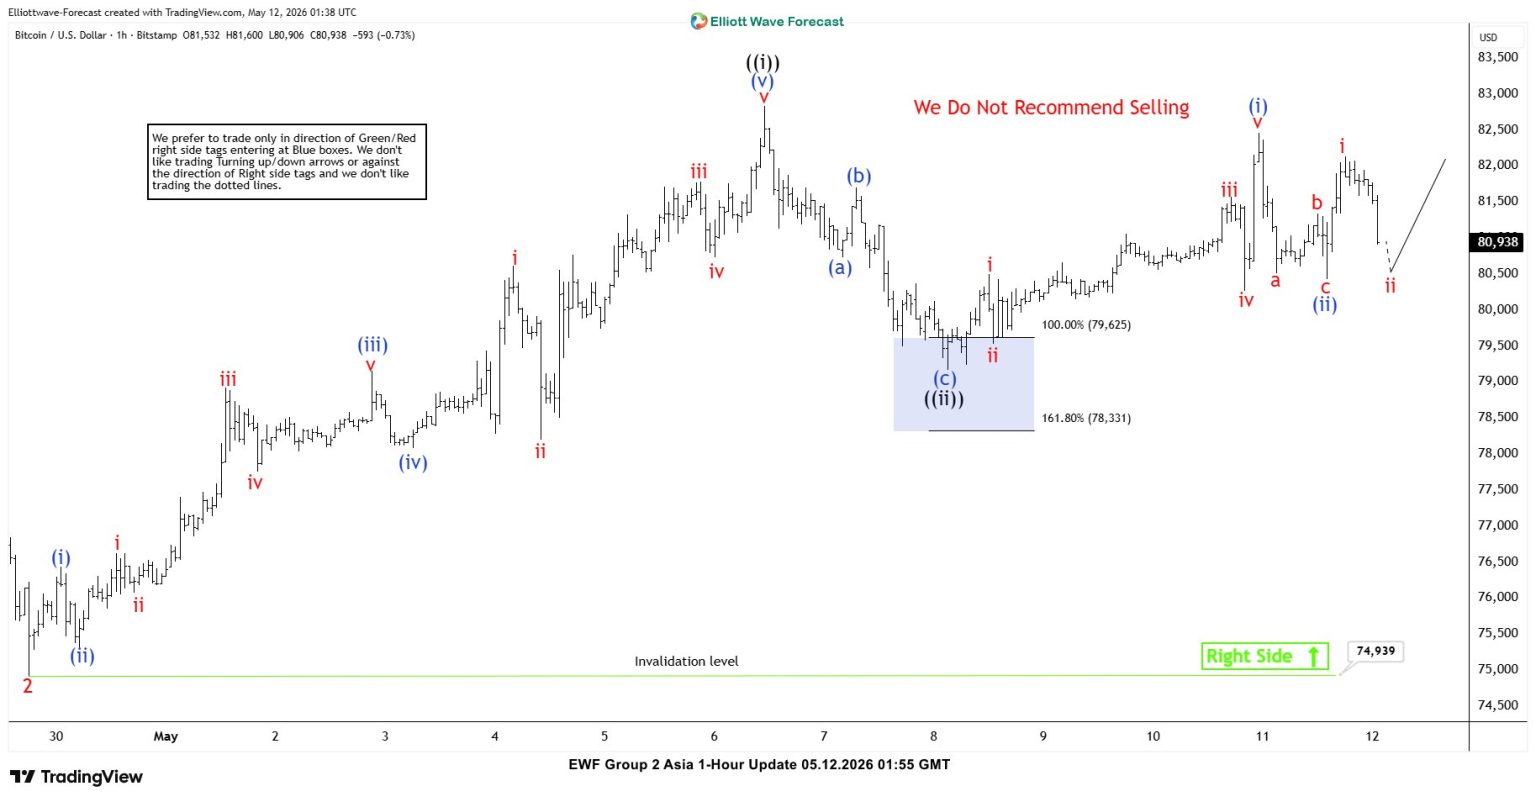
This is the latest 1-hour Elliott wave Chart from the 5.12.2026 Asia update. In which the Bitcoin is showing a reaction higher taking place, right after ending the zigzag correction within the blue box area. Allowed members to create a risk-free position shortly after taking the long position at the blue box area. However, a break above $82833 high is needed to confirm the next leg higher towards $87072- $91961 target area.