
The US Dollar (USD) faces slight selling in the European trading session on Tuesday due to renewed hopes of a potential deal between the United States (US) and Iran. As of writing, the US Dollar Index (DXY), which tracks the Greenback’s value against six major currencies, trades 0.1% lower to near 99.90.
US Dollar Price Today
The table below shows the percentage change of US Dollar (USD) against listed major currencies today. US Dollar was the weakest against the New Zealand Dollar.
| USD | EUR | GBP | JPY | CAD | AUD | NZD | CHF | |
|---|---|---|---|---|---|---|---|---|
| USD | -0.05% | -0.19% | 0.00% | -0.11% | -0.10% | -0.35% | -0.11% | |
| EUR | 0.05% | -0.12% | 0.07% | -0.06% | -0.01% | -0.27% | -0.04% | |
| GBP | 0.19% | 0.12% | 0.19% | 0.08% | 0.07% | -0.11% | 0.08% | |
| JPY | 0.00% | -0.07% | -0.19% | -0.12% | -0.11% | -0.35% | -0.12% | |
| CAD | 0.11% | 0.06% | -0.08% | 0.12% | 0.00% | -0.22% | -0.01% | |
| AUD | 0.10% | 0.01% | -0.07% | 0.11% | -0.01% | -0.22% | -0.01% | |
| NZD | 0.35% | 0.27% | 0.11% | 0.35% | 0.22% | 0.22% | 0.22% | |
| CHF | 0.11% | 0.04% | -0.08% | 0.12% | 0.00% | 0.00% | -0.22% |
The heat map shows percentage changes of major currencies against each other. The base currency is picked from the left column, while the quote currency is picked from the top row. For example, if you pick the US Dollar from the left column and move along the horizontal line to the Japanese Yen, the percentage change displayed in the box will represent USD (base)/JPY (quote).
The US-Iran deal prospects have improved, following comments from President Donald Trump that negotiations with Tehran are in “final throes” and suggested that the Strait of Hormuz, a vital passage to almost 20% of global energy supply, could open up in “two or three days” if an agreement with Tehran is secured, The Guardian reported.
Such a scenario is unfavorable for the US Dollar, as it has outperformed in the past few months due to elevated energy prices in the wake of Hormuz closure. Higher energy prices prompted the US inflation and eventually hawkish Federal Reserve (Fed) bets.
On the domestic front, investors await the US Consumer Price Index (CPI) data for May, which will be released on Wednesday. The US headline CPI is expected to arrive higher at 4.2% Year-on-Year (YoY) from 3.8% in April. Signs of US inflationary pressures accelerating would prompt expectations for Fed interest rate hikes.
In the last two trading days, hawkish Fed prospects have intensified after the release of the upbeat US Nonfarm Payrolls (NFP) data for May.
US Dollar Index technical analysis
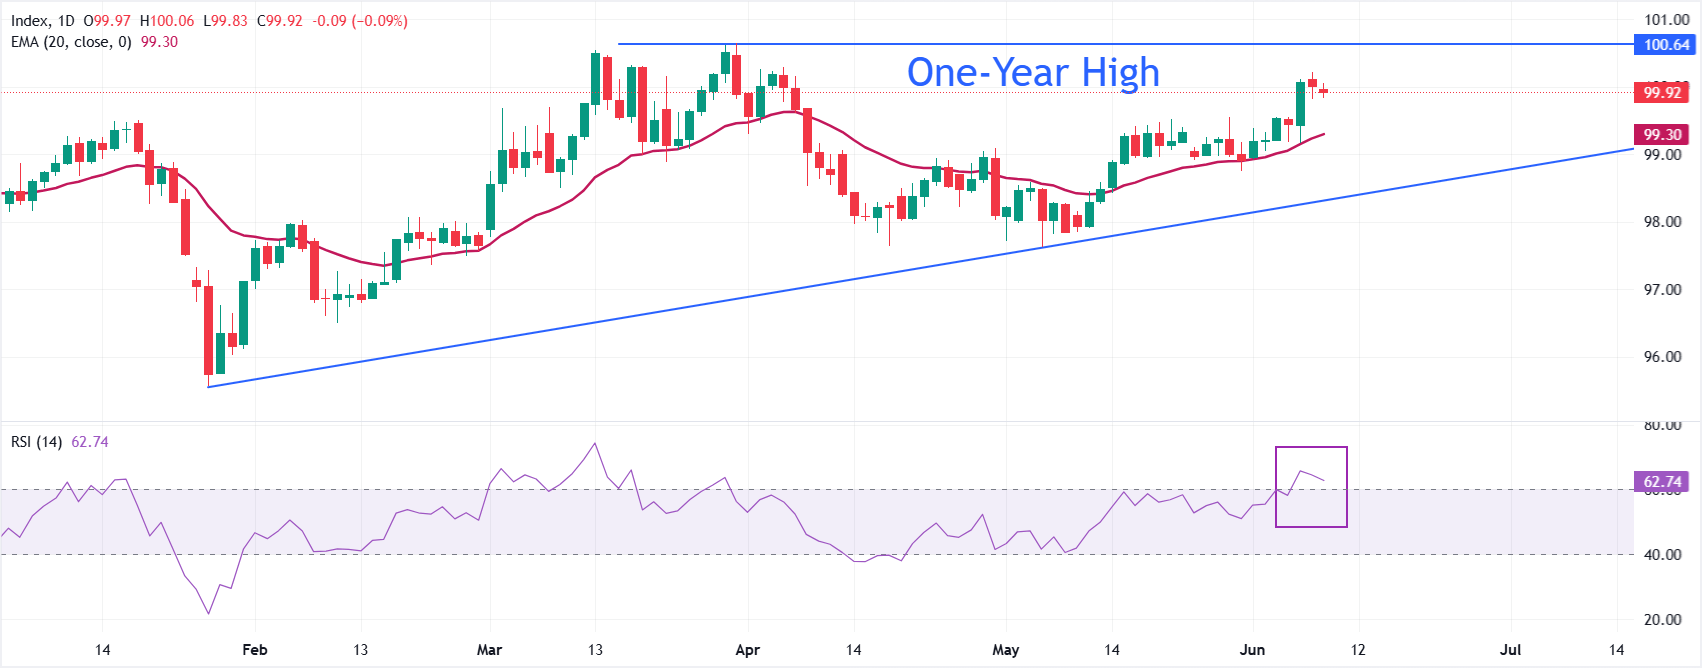
The Dollar Index Spot ticks lower at around 99.90. However, the near-term bias is bullish as price holds above the 20-day exponential moving average (EMA), which is at roughly 99.30 and comfortably above the rising trend-line support drawn from the 95.55 area, which now comes in near 98.34.
The Relative Strength Index (14) hovers in the low 60s, suggesting firm positive momentum without yet signaling overbought conditions, which reinforces the constructive tone while the index consolidates just under the 100 handle.
On the downside, initial support is seen at the 20-day EMA around 99.30, with the next, stronger layer aligning with the upward-sloping trend-line support near 98.34. A daily close below this latter zone would weaken the current bullish structure and open the door for a deeper retracement. Looking up, the spot could reclaim the one-year high at 100.64 if it breaks above the June 8 high at 100.20.
(The technical analysis of this story was written with the help of an AI tool.)
US Dollar FAQs
The US Dollar (USD) is the official currency of the United States of America, and the ‘de facto’ currency of a significant number of other countries where it is found in circulation alongside local notes. It is the most heavily traded currency in the world, accounting for over 88% of all global foreign exchange turnover, or an average of $6.6 trillion in transactions per day, according to data from 2022.
Following the second world war, the USD took over from the British Pound as the world’s reserve currency. For most of its history, the US Dollar was backed by Gold, until the Bretton Woods Agreement in 1971 when the Gold Standard went away.
The most important single factor impacting on the value of the US Dollar is monetary policy, which is shaped by the Federal Reserve (Fed). The Fed has two mandates: to achieve price stability (control inflation) and foster full employment. Its primary tool to achieve these two goals is by adjusting interest rates.
When prices are rising too quickly and inflation is above the Fed’s 2% target, the Fed will raise rates, which helps the USD value. When inflation falls below 2% or the Unemployment Rate is too high, the Fed may lower interest rates, which weighs on the Greenback.
In extreme situations, the Federal Reserve can also print more Dollars and enact quantitative easing (QE). QE is the process by which the Fed substantially increases the flow of credit in a stuck financial system.
It is a non-standard policy measure used when credit has dried up because banks will not lend to each other (out of the fear of counterparty default). It is a last resort when simply lowering interest rates is unlikely to achieve the necessary result. It was the Fed’s weapon of choice to combat the credit crunch that occurred during the Great Financial Crisis in 2008. It involves the Fed printing more Dollars and using them to buy US government bonds predominantly from financial institutions. QE usually leads to a weaker US Dollar.
Quantitative tightening (QT) is the reverse process whereby the Federal Reserve stops buying bonds from financial institutions and does not reinvest the principal from the bonds it holds maturing in new purchases. It is usually positive for the US Dollar.