
The US natural gas market (XNG/USD) is entering the summer season under the influence of two opposing forces. Domestically, the picture remains bearish. According to the EIA, working gas in underground storage stood at 2,688 billion cubic feet as of 5 June 2026, which is 151 billion cubic feet above the five-year average. At the same time, gas deliveries to major LNG export terminals have fallen to 16.3 billion cubic feet per day, as seasonal maintenance work at the Golden Pass and Freeport LNG facilities in Texas has constrained export flows.
On the other hand, global LNG demand is strengthening. On 9 June, Morgan Stanley warned that LNG prices could rise to levels not seen in more than three years. Hot weather across Asia and Europe’s need to replenish gas reserves are intensifying competition for available LNG supplies. Should demand continue to increase, a greater share of US LNG could be redirected to overseas markets, potentially providing support for domestic natural gas prices over the longer term.
Technical Picture
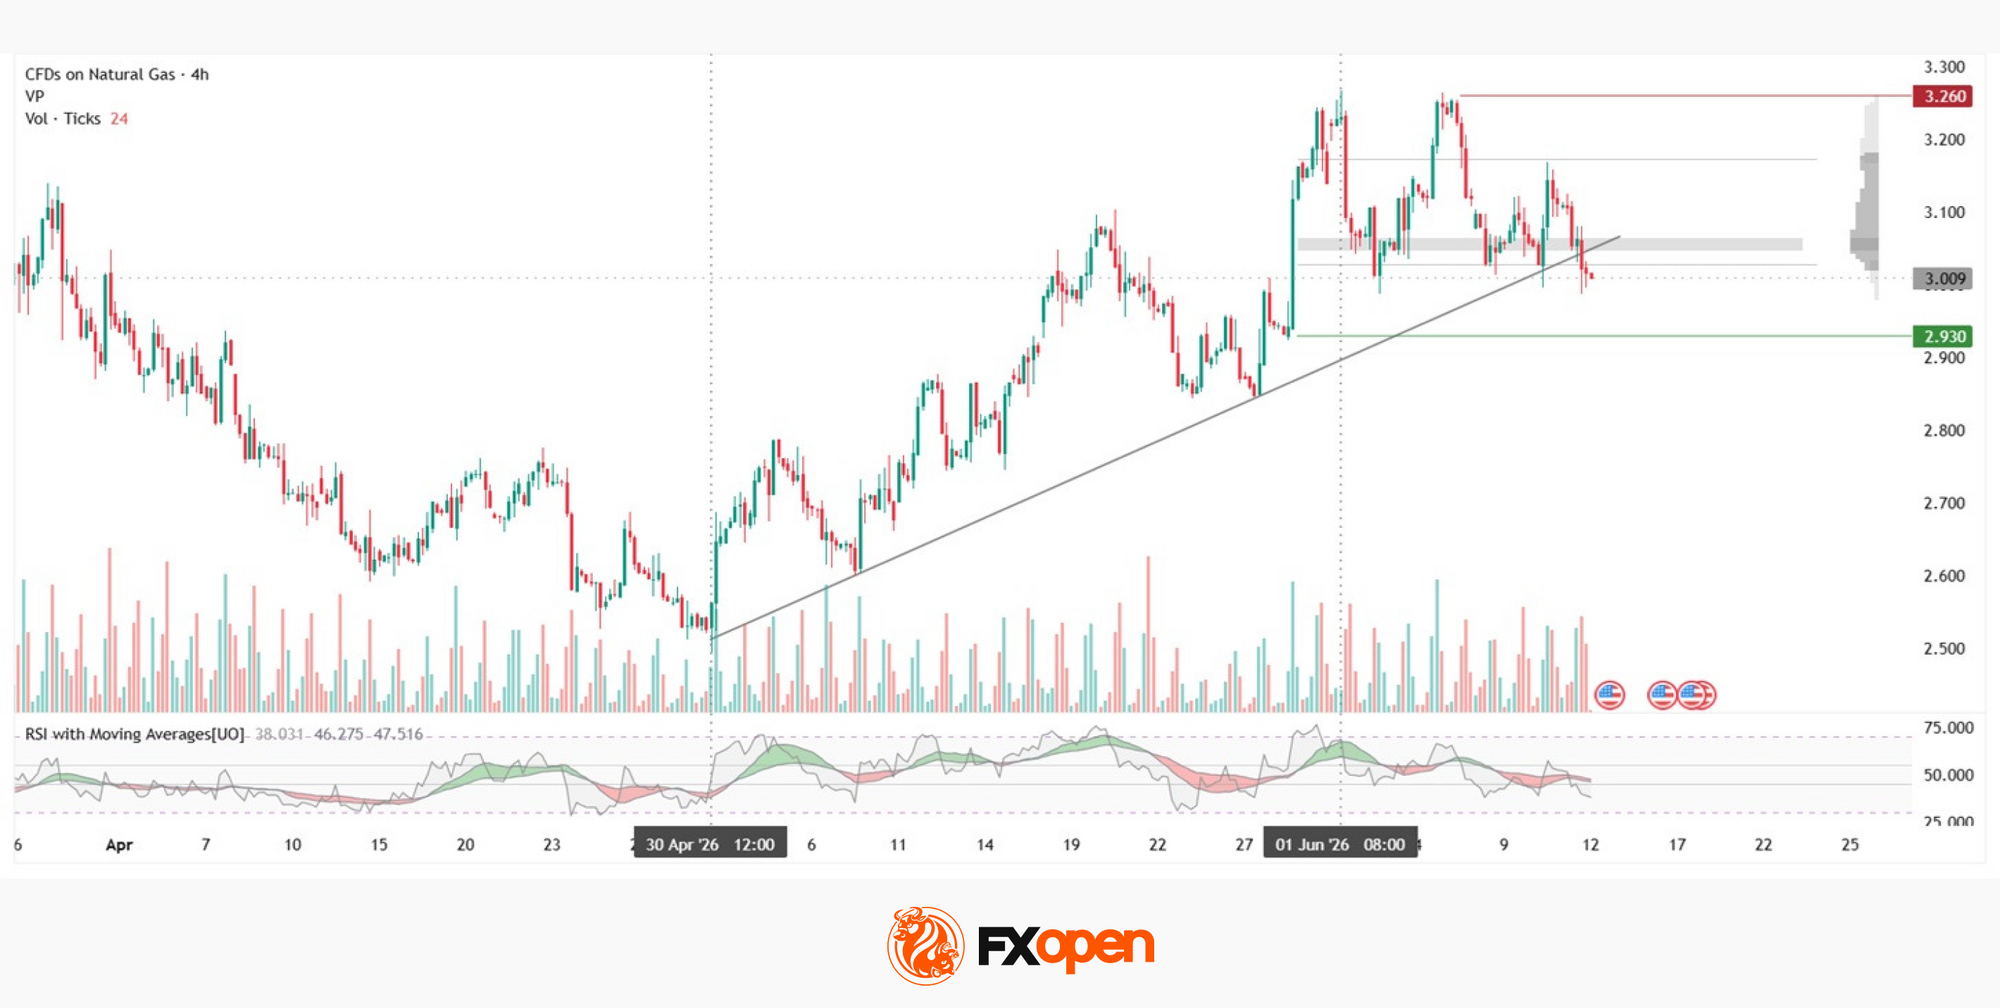
Since late April, US Natural Gas has been developing an upward trend on the H4 chart, supported by a series of higher lows. The trendline underpinned the advance up to the peak near $3.260 — a resistance level marked in red, from which the price was rejected twice. Following the second test, the current decline began, and by 11 June the price had moved below the ascending trendline, making its first attempt to break it. Volume on the bearish candle of 11 June increased noticeably, drawing attention to the significance of the attempted trendline break. Under such a scenario, the support level marked in green near $2.930 could come into focus for buyers.
The lower boundary of the horizontal profile at $3.030 and the point of control at $3.050–3.060 are positioned very close together, forming a cluster that could act as resistance should a recovery attempt develop. The RSI and its moving averages are currently reading 38/46/47. The oscillator remains below both moving averages but has not yet entered oversold territory, while the moving averages, highlighted in red, have yet to reach the lower boundary of the neutral zone at 45.
Key Takeaways
The inventory surplus in the United States and reduced export flows from US LNG terminals remain the dominant fundamental factors affecting the market. Technically, the price is testing the ascending trendline amid increased trading volume while remaining below the cluster formed by the profile’s lower boundary and the point of control. Further price action will largely depend on weather forecasts and the EIA’s weekly storage reports.
Start trading commodity CFDs with tight spreads (additional fees may apply). Open your trading account now or learn more about trading commodity CFDs with FXOpen.
This article represents the opinion of the Companies operating under the FXOpen brand only. It is not to be construed as an offer, solicitation, or recommendation with respect to products and services provided by the Companies operating under the FXOpen brand, nor is it to be considered financial advice.