
US Dollar Index Analysis: Dollar at a Crucial Point, What’s Next?
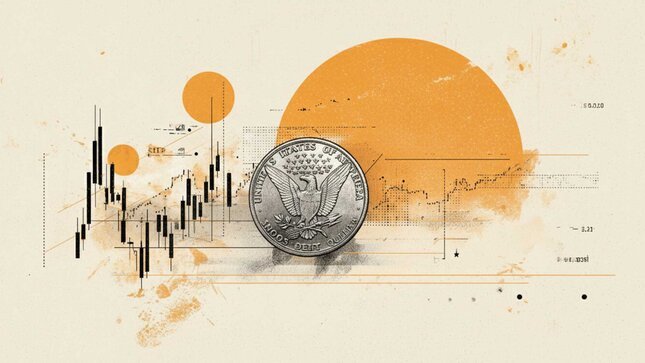
As the chart shows, the US Dollar Index (DXY) has gained more than 4% from its January lows, with the move accelerating from February 2026 onwards. Today, the dollar finds…
Dollar: De-Escalation Sends Bulls Fleeing
• Rumours of an imminent peace deal in the Middle East sent the USD index tumbling. • The ECB raised interest rates but did not signal that the cycle would…

Wall Street Surges as Trump Signals a Breakthrough Peace Deal with Iran
Key takeaways Global stock markets staged a powerful relief rally after President Trump signalled that a comprehensive peace agreement between the US and Iran could be reached soon, triggering a…
US Dollar: Upside risks persist on resilient data – BBH
Brown Brothers Harriman’s Elias Haddad notes that the positive shift in US-Iran relations initially weighed on the US Dollar (USD), but he still expects the USD to edge higher near…
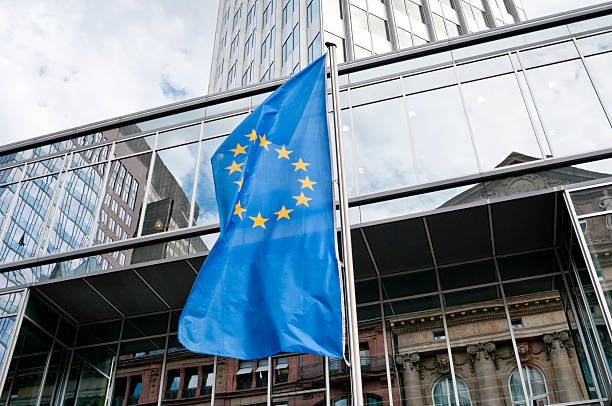
ECB Hikes As Expected, One More Likely in September
In focus today UK April GDP is released today. PMIs suggest the economy remained in growth territory in April and only slowed in May, although market consensus expects GDP in…

USDJPY Wave Analysis – ActionForex
USDJPY: ⬇️ Sell – USDJPY reversed from strong resistance level 160.50 – Likely to fall to support level 159.00 USDJPY currency pair recently reversed down from the strong resistance level…

US Natural Gas: Inventory Surplus Continues to Weigh on Prices
The US natural gas market (XNG/USD) is entering the summer season under the influence of two opposing forces. Domestically, the picture remains bearish. According to the EIA, working gas in…
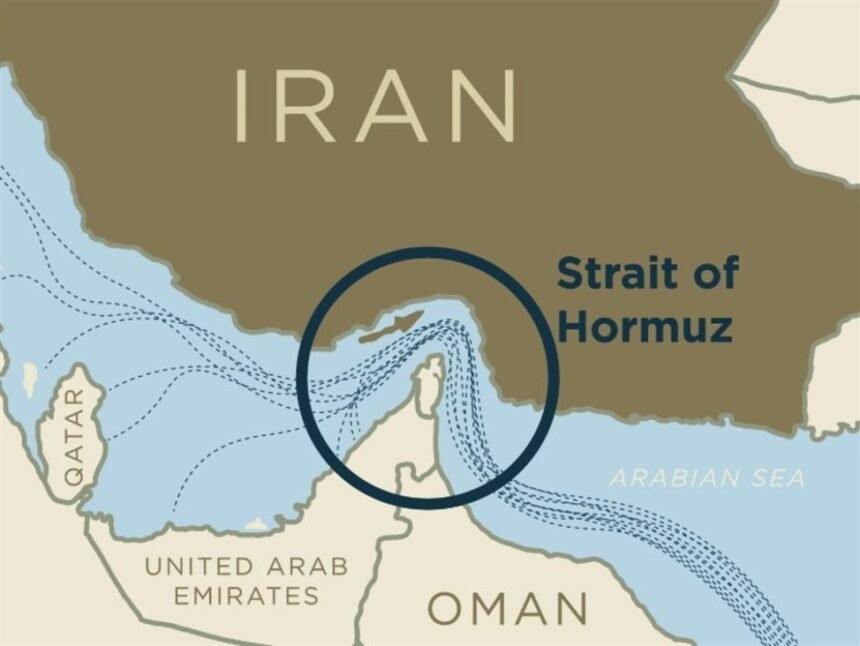
More on this – Iran blocks Hormuz tanker as closure threat takes effect
This incident represents a tangible enforcement of Iran's announced closure of the Strait of Hormuz, a stark contrast to Trump's framing of a deal that would reopen the waterway. With…

Sunrise Market Commentary
Markets The ECB as expected raised its policy rate by 25 bps to 2.25%. After already pondering the impact of the war in the Middle East in April, new projections…

Euro steadies against British Pound following UK GDP, German HICP inflation data
EUR/GBP inches lower after two days of gains, trading around 0.8630 during the Asian hours on Friday. The currency cross remains subdued following the release of economic data from the…