Key Highlights
- GBP/USD started a major decline below 1.3450 and 1.3420.
- It traded below a contracting triangle with support at 1.3410 on the 4-hour chart.
- EUR/USD dipped heavily before the bulls appeared near 1.1500.
- Gold extended losses below $4,400 and tested $4,280.
GBP/USD Technical Analysis
The British Pound failed to surpass 1.3520 against the US Dollar. GBP/USD started a fresh decline below 1.3460 and 1.3450 to move into a bearish zone.
Looking at the 4-hour chart, the pair traded below a contracting triangle with support at 1.3410. The pair settled well below the 100 simple moving average (red, 4-hour) and the 200 simple moving average (green, 4-hour).
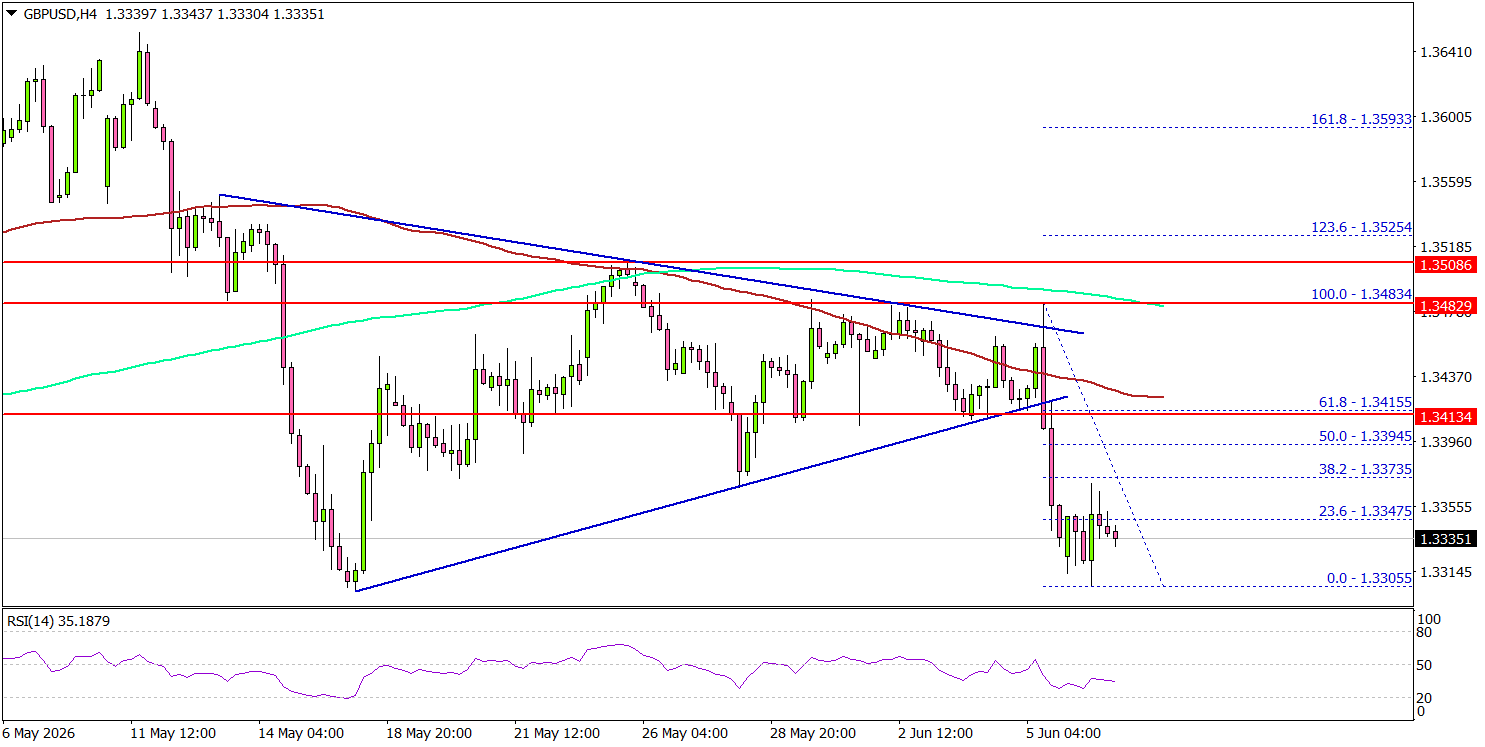
It even tested 1.3300 before the bulls took a stand. The pair is now consolidating losses above 1.3300. On the upside, an immediate resistance could be 1.3375. The next major resistance might be 1.3400.
A close above 1.3400 could open doors for gains. The main hurdle for the bulls could be 1.3420 and the 100 simple moving average (red, 4-hour). If there is a close above 1.3420, the pair could rise toward the 1.3480 level.
Immediate support could be 1.3300. The first major support might be 1.3280. A close below 1.3280 could open the doors for a larger decline toward 1.3220. Any more losses might set the pace for a test of 1.3150.
Looking at EUR/USD, the pair found support near 1.1500, started a consolidation phase, and might soon attempt a recovery wave.
Upcoming Key Economic Events:
- US Existing Home Sales for May 2026 (MoM) – Forecast +0.1%, versus +0.2% previous.