
The S&P500 SPX appears to have completed a short term bearish cycle that corrected the rallies from late March 2026. The short term path continues to favor more upside. What are the next targets to take note of. How should intraday and short-term traders approach it?
The SPX completed the intermediate degree wave (2) on March 30, 2026. Since hitting this low, the index has trended higher, consistently attracting fresh buying interest. The broader bullish wave ((3)) began in April 2025 and concluded in February 2026, with the February peak identified as wave (1) of ((3)). A subsequent wave (2) pullback completed a 7-swing structure within the 6508-6298 blue box zone in late March 2026. Members successfully entered long positions at this blue box and achieved all major targets. This post outlines the setup for educational purposes.
SPX Elliott Wave Analysis – Short term, 13th June Update
Starting from the March 2026 low, a new bullish cycle initiated for wave 1 of (3), which peaked in early June. Following this, we observed a pullback for wave 2 of (3). Although we typically anticipate a 3, 7, or 11-swing structure for such corrections, this particular pullback was shallow. We identified the end of this wave based on proprietary signals shared during our live sessions, allowing us to pivot and encourage members to enter long positions within our blue box zones—a strategy that proved successful, as seen in our setup for the Dow_100 ($YM_F) HERE. While the SPX wave 2 pullback did not reach the typical extreme, we chose not to force the count and instead shared the updated analysis with members on June 13, 2026.
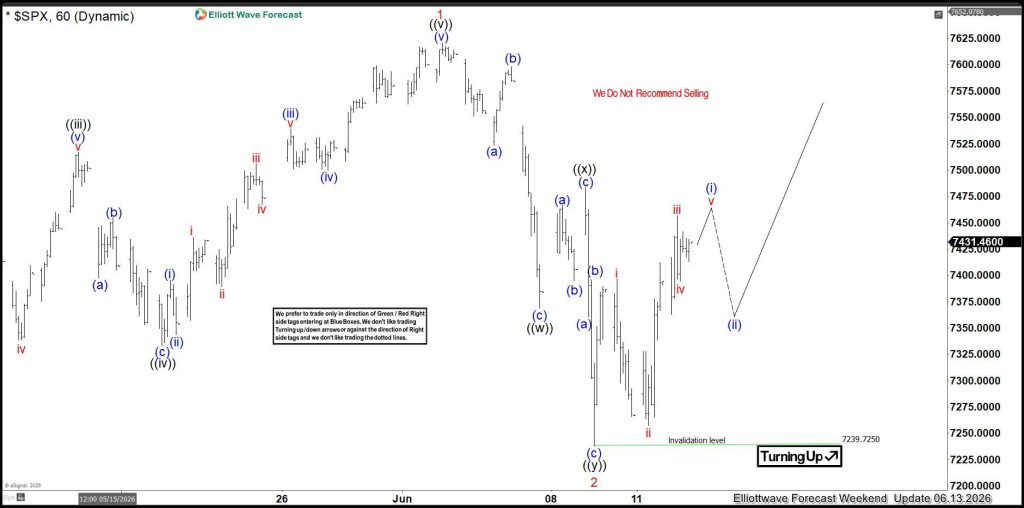
The 60-minute chart above confirms that wave 2 has concluded, signaling an expected bullish reversal. Consequently, we projected a five-wave rally from the 7239 pivot to complete wave (i) of ((i)) of 3. As the new week commenced, the market delivered the anticipated upside burst, which we have detailed in the chart below shared with our members.
SPX Elliott Wave Analysis – Short term, 16th June Update
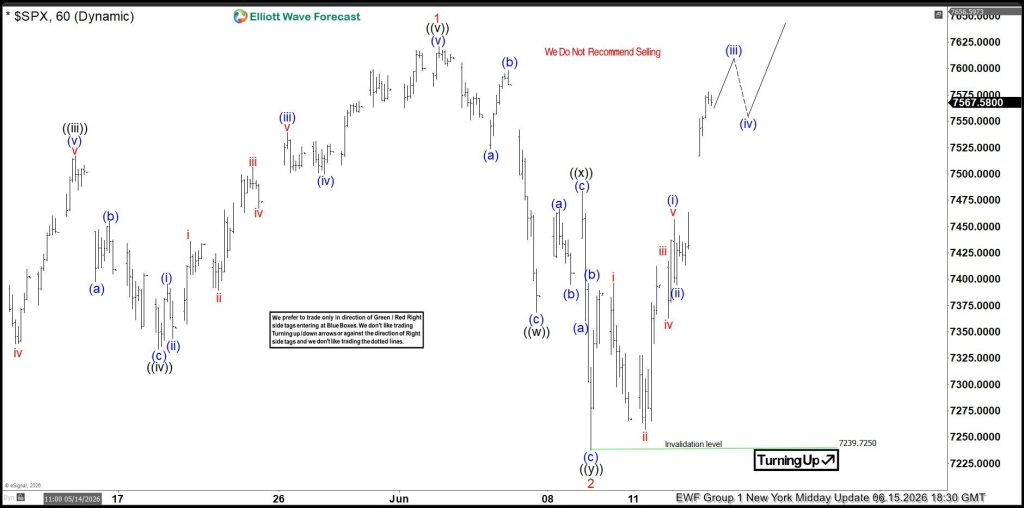
The latest chart indicates that the price is currently advancing within wave (iii) of ((i)), with the potential for wave ((i)) to establish a new high. Following this, we anticipate a pullback for wave ((ii)) before the broader bullish trend resumes. The target for wave 3 is set at a minimum of 8540, with an ideal range of 8846–9344. Once a new high is reached in June, we will look for 3, 7, or 11-swing pullbacks to identify long opportunities in the SPX, as well as in other US indices, the Nikkei, and various other markets we track. We will provide our members with updated “blue box” entry zones when the time is right. Furthermore, our daily technical videos, live analysis sessions, and 24-hour members-only chat room ensure that traders are kept informed of any market shifts and have direct access to our analysts for real-time support.
About Elliott Wave Forecast
At www.elliottwave-forecast.com, we update one-hour charts four times daily and four-hour charts once daily for all 78 instruments. We also conduct daily live sessions to guide clients on the right side of the market. Additionally, we have a chat room where moderators answer market-related questions. Experience our service with a 14-day trial for only $0.99. Cancel anytime.