
The short-term Elliott Wave analysis of EURUSD shows that the decline from the April 17, 2026 peak is unfolding as a five-wave impulse. From the April 17 high, wave ((i)) ended at 1.1655. A corrective rally in wave ((ii)) then followed which terminated at 1.1796. The pair then moved lower in wave ((iii)), reaching 1.1576. Afterward, wave ((iv)) completed at 1.164 in the form of a triangle, confirming the continuation of bearish momentum.
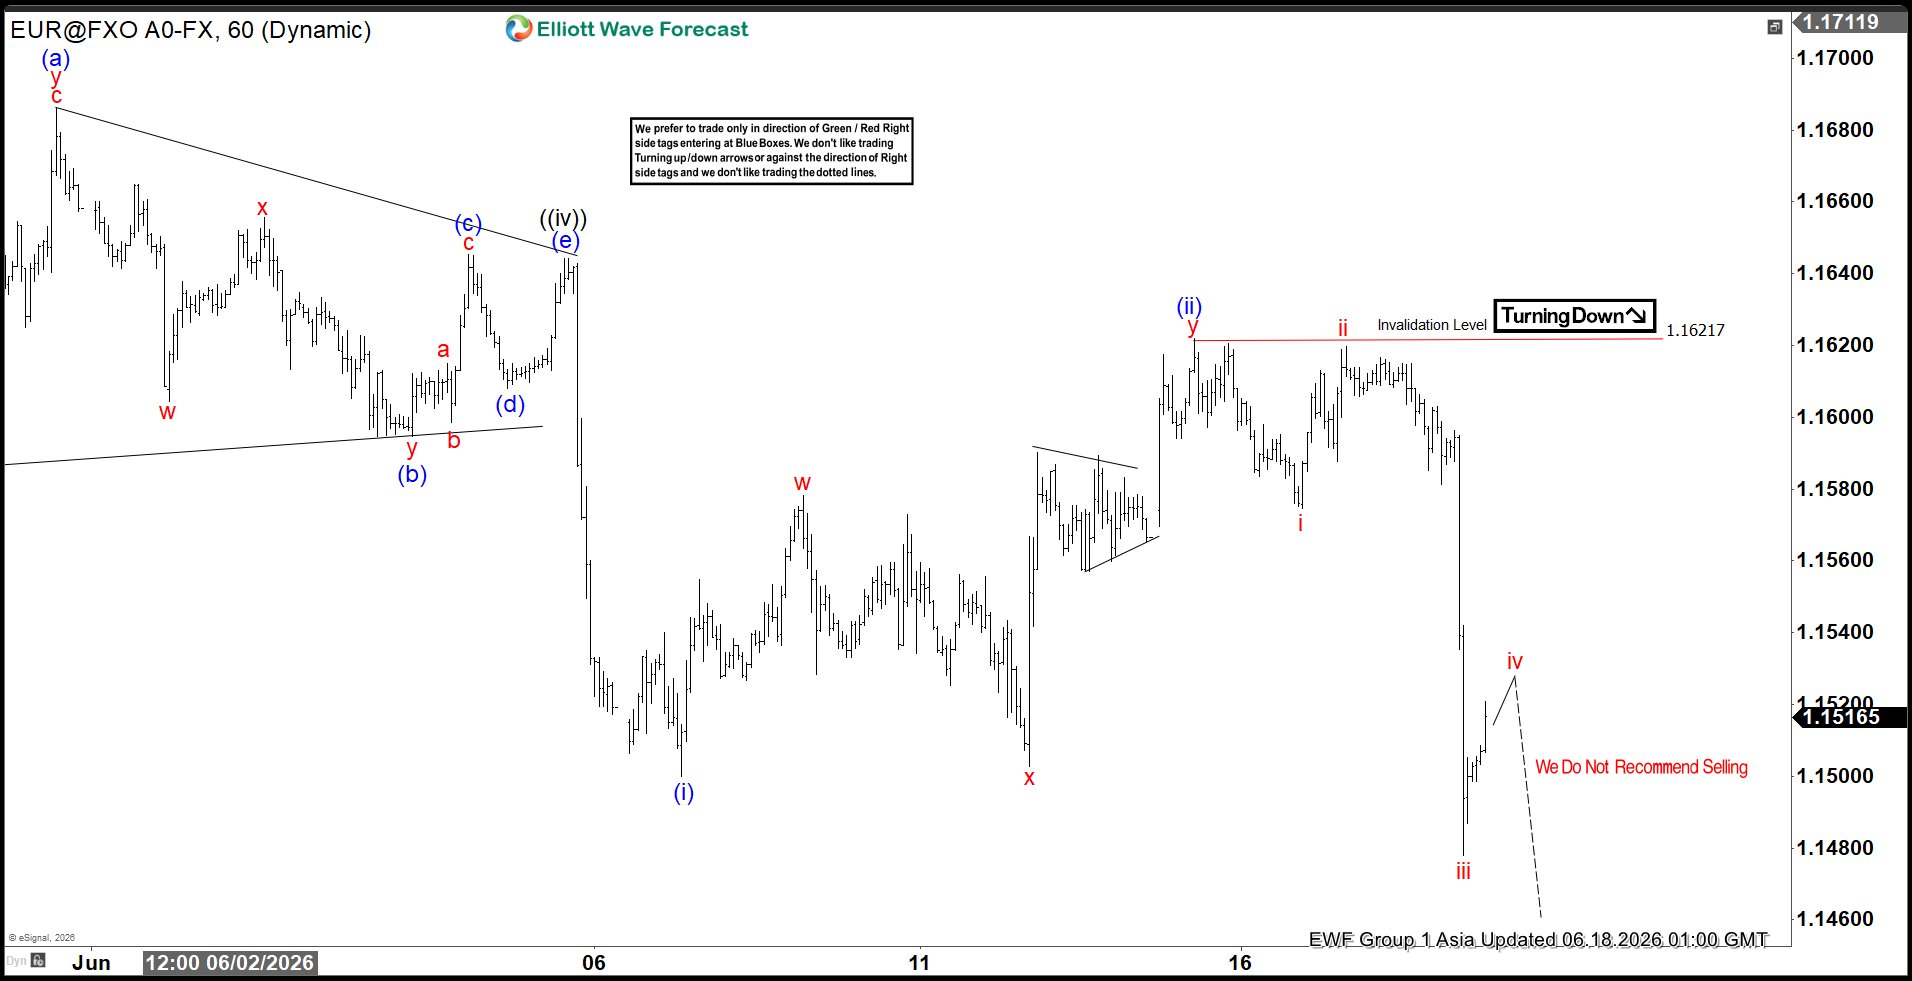
The market has since resumed lower in wave ((v)), which subdivides into a smaller degree impulse. From wave ((iv)), wave (i) concluded at 1.15, while wave (ii) retraced to 1.1622. The expectation is that EURUSD will continue declining through further subdivisions before completing wave (v) of ((v)). This completion would mark the end of wave 1 in the larger degree, thereby concluding the cycle that began from the April 17 high. Once wave 1 is finalized, the pair should enter a corrective rally of larger degree before resuming its downward path. Pair can potentially extend lower to the extreme area from January 27 peak towards 1.075 – 1.117. In the near term, as long as the pivot at 1.1845 remains intact, rallies are expected to fail within corrective structures of three or seven swings.
EURUSD 60-Minute Elliott Wave Chart
 EURUSD Elliott Wave Video:
You are currently viewing a placeholder content from Default. To access the actual content, click the button below. Please note that doing so will share data with third-party providers.