- USDCAD rises above 1.3700 as gains extend for second consecutive week.
- Technical bias remains positive, but caution emerges near 50-SMA.
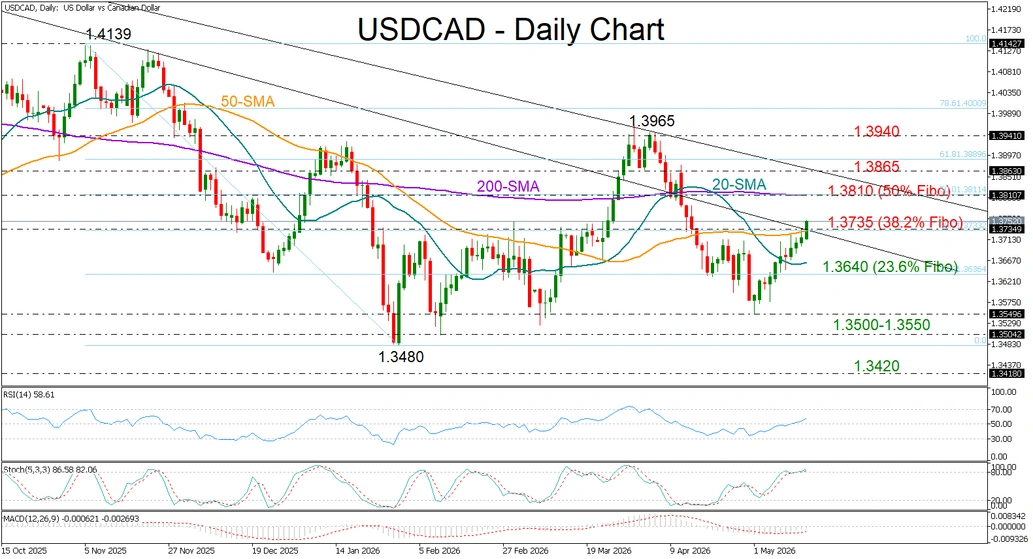
USDCAD has traded mostly in positive territory since the beginning of May. After stabilizing around the 1.3500 region for the third time this year, the pair is now attempting to close above its 50-day simple moving average (SMA) near 1.3735. The move follows President Trump’s comments expressing limited patience over Iran-related tensions, while two-day talks with China conclude.
Both the RSI and the MACD suggest improving buying momentum. However, the stochastic oscillator, which is hovering in overbought territory, signals caution as the pair tests the 38.2% Fibonacci retracement of the November–February decline near 1.3735. A decisive break above this level could pave the way toward the 200-day SMA and the 50.0% Fibonacci retracement at 1.3810. Slightly higher, a critical battle could emerge around the descending trendline connecting the 2025 and 2026 highs near 1.3860.
If the pair fails to maintain momentum above the 50-day SMA, it could retreat toward the 23.6% Fibonacci level at 1.3640. A deeper pullback may then retest the 1.3500-1.3550 zone, a break of which could reinforce the broader bearish outlook and expose the 2024 support level at 1.3420.
Overall, USDCAD remains in a bullish short-term mode, with further gains likely if buyers manage to clear the 1.3735 resistance area decisively. Nevertheless, the broader outlook remains bearish as long as the pair stays below 1.3860.