- WTI Oil took a significant hit throughout yesterday’s session as Axios revealed a more US-Iran deal under construction, and these flows are extending in today’s session
- Confirming its price action below $100, sellers are attempting a push towards $90. Will momentum be enough to break the key level?
- Exploring an in-depth Technical Analysis of the commodity
WTI Crude Oil dropped sharply yesterday after Axios reported that the US and Iran are working on a broad peace deal. The strong selling pressure is continuing into today.
After falling 8% yesterday, WTI is down another 5% today. Sellers are clearly getting in control of the market.
For months, prices rose steadily due to geopolitical tensions. Now, the trend has quickly shifted to a clear downward move. Now that prices have dropped below the key $100 level, the pressure is falling, and sellers are pushing toward $90.
The main question is whether this momentum will break that important support, as momentum becomes slightly oversold and Participants will look to confirm the latest narratives.
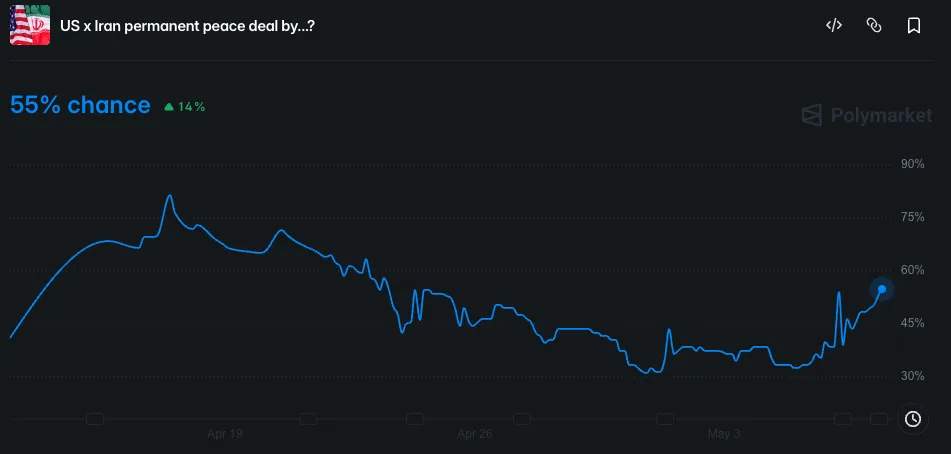
Peace Deal odds for June 30 – Source: Polymarket
The prediction-market odds US-Iran peace deal by June 30 are currently around 55% after remaining around 30% for a while – A peace deal by May 31 is quite optimistic, but the odds are also rising above 40%.
Traders are selling oil mainly because negotiations are moving toward an agreement to reopen the Strait of Hormuz, as confirmed by a report from Al Arabiya . Allowing normal shipping through this key route is a major reason for the drop in oil prices.
But for oil to fall another $20 and for gas prices to drop for consumers, a formal deal still needs to be signed.
This possible peace will need to be confirmed during the coming weeks of diplomatic talks, which recent statements have hinted at – With the much anticipated Trump-Xi meeting taking place next week, this could be an important date for the Oil Market.
Now, let’s take a closer look at the technical analysis for WTI Crude to see if sellers can push prices below the $90 support level.
US Oil Intraday Timeframe Analysis
WTI 4H Chart and Technical Levels
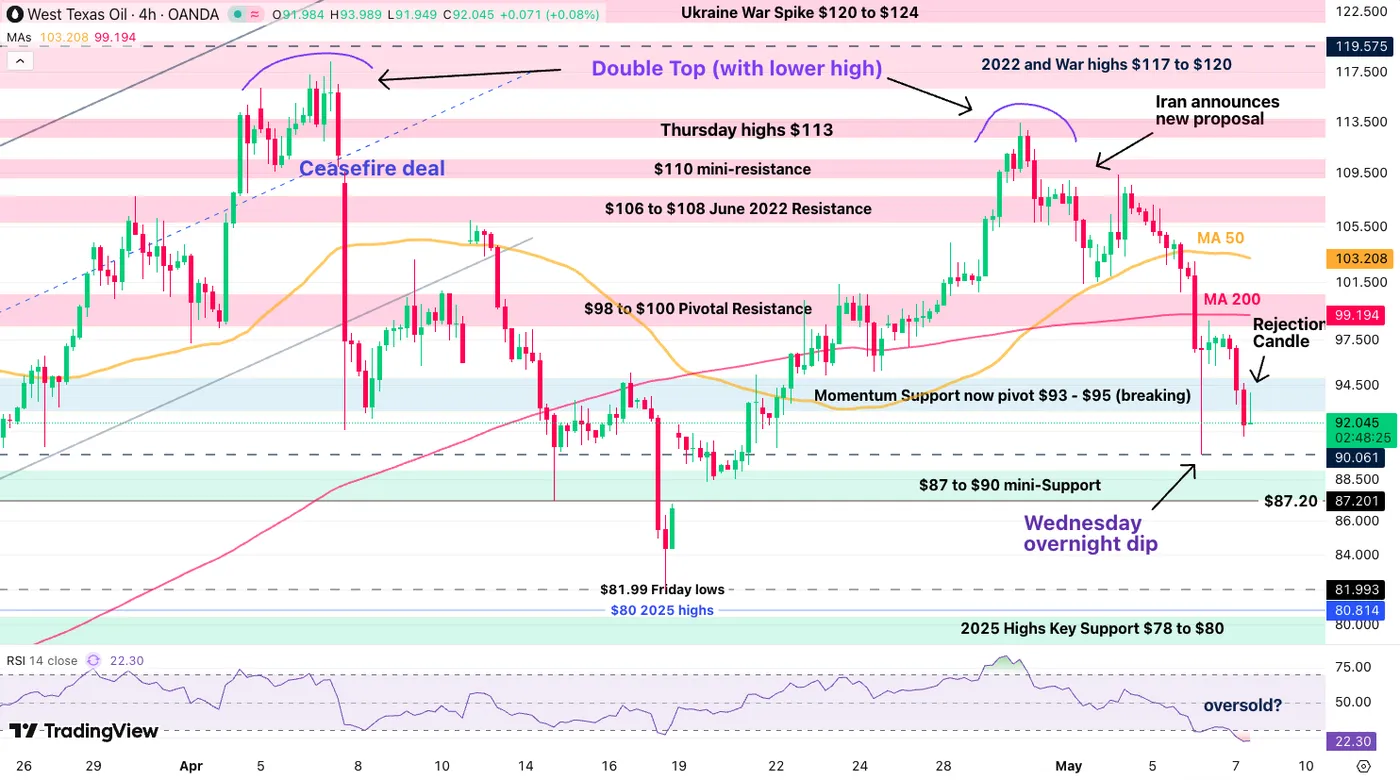
WTI Oil 4H Chart – May 7, 2026. Source: TradingView
WTI has officially formed a decent looking top, with a lower high throughout the past week leading to the ongoing tumble, down 19% since its April 29 top.
Now breaking the key $93 Pivot zone with momentum, establishing below this area will be essential to confirm more downside ahead.
Higher timeframe traders will want to see a break and close below $90 to confirm.
WTI Technical Levels:
Resistance Levels
- Momentum Support now pivot $93 – $95 (breaking)
- $98 to $100 Pivotal Resistance
- $104 next-mini resistance (morning highs!)
- 2022 and Monday highs $117 to $120 (larger channel top)
Support Levels
- $90 Psychological level and past session’s lows
- $87 to $90 mini-Support
- $82 Friday 17 lows
- 2025 Highs Key Support $78 to $80
1H Chart and Action Levels
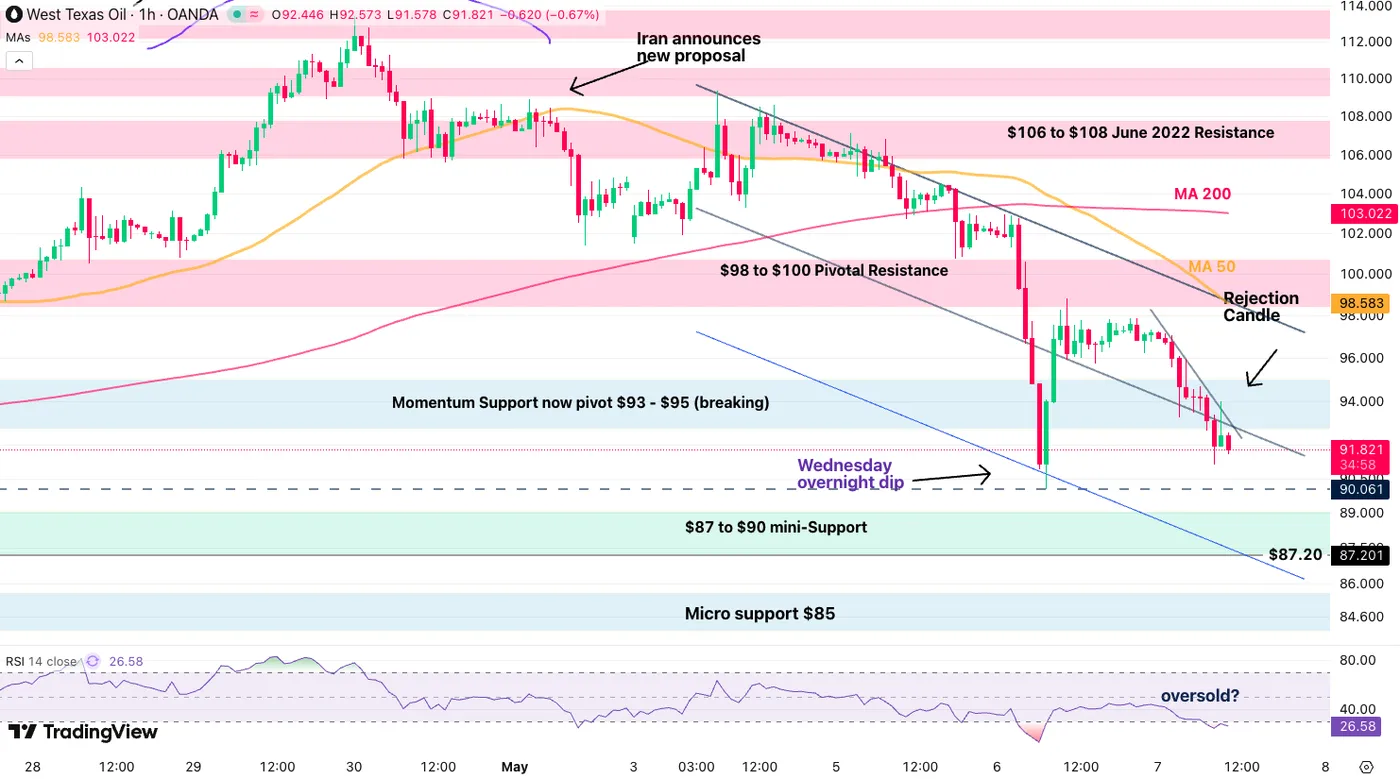
WTI Oil 1H Chart – May 7, 2026. Source: TradingView
Swing trading such erratic Markets remain a fantasy, hence it could always be wiser to capture quick moves and re-assess with the news.
The action is currently oversold on most shorter timeframes, a reason why the selloff has somewhat stalled in the last hour. But Traders should still look at these elements:
- As long as the price action remains below $94.00, bears remain in control.
- Watch out for minor upside consolidation around here; if the action stays stuck below the level, this adds to odds of a downside break.
- The selloff should accelerate if heavy volume sales occur below $90.
- Breaking back above $95 would hint at more rangebound or rallying action ahead (all the way to $103)
Safe Trades and Keep your eyes on the news!