The Crude Oil market has spent the week busily unwinding a war that has not actually been settled. West Texas Intermediate (WTI) has slid toward the mid-70s and Brent has slipped to just under 80, handing back almost the whole premium built since the Strait of Hormuz was throttled in late February. The trigger is an interim US-Iran ceasefire and the first tankers threading the waterway again; the tape has swallowed the story whole.
The awkward part is that the ceasefire is already fraying, with the first round of talks slipping from Friday into the middle of next week. More to the point, the physical market beneath the screen looks nothing like the clean, reopened supply chain that futures are busy pricing. On a longer horizon, the bears have it right that a glut is coming; they simply have the calendar badly wrong.
The real tightness has moved downstream
The selloff rests on a quiet assumption that cheaper Crude Oil means cheaper everything; that is exactly where it breaks down. The closure hit refined products, diesel, jet fuel and petrochemical feedstocks, far harder than it hit Crude Oil itself; those markets have stayed tight even as the benchmarks rolled over. Margins on middle distillates ran to multi-year highs through the spring; regional jet fuel margins spiked to levels that only appear when a buyer is genuinely short of supply.
Refining capacity does not answer to ceasefires
Even a sustained fall in Crude Oil would not loosen the part of the chain that is actually binding. Refining capacity is the constraint; a run of permanent plant closures has stripped out more than a million barrels a day of processing that no peace deal restores. The lighter grades pulled hardest by US shale are also relatively poor in the middle-distillate cuts that become diesel and jet fuel; more domestic Crude Oil therefore does little to refill the tightest products.
The delivery hub is running on fumes
Upstream, the picture is no looser. Commercial stockpiles at the main US delivery hub have drained for eight straight weeks to roughly 20 million barrels, near what traders treat as the operational floor. The broadest measure of US stocks now sits at levels last seen in the mid-1980s, the product of record exports as the country turned into the seller of last resort for a Gulf-starved market. That is the opposite of the well-stocked backdrop a falling price implies.
A reopened Strait is not a flowing one
The reopening itself is being treated as a switch when it behaves more like a slow dial. Clearing mines takes months rather than days; repositioning the tankers stranded in the Gulf takes weeks longer; restarting shut-in fields is slower still, since forced shutdowns can damage reservoir pressure and leave wells degraded. Consultants briefing the big producers have warned that flows may not reach pre-war levels until deep into next year. The market has front-run a recovery that cannot physically arrive on the schedule the price now assumes.
The glut is real, just not yet
None of this means the bears are wrong on direction. Once the waterway clears and Gulf barrels genuinely return, the structural setup turns heavy. Demand has already been hollowed out by the spring spike, with official forecasts now expecting global consumption to shrink this year; supply is set to outrun it as the shut-in barrels come back. The same forecasts pencil in inventories building briskly and the Brent price drifting toward the low-70s by the fourth quarter, with more downside in 2027. The honest read is a two-part curve: tight and underpriced now, oversupplied later.
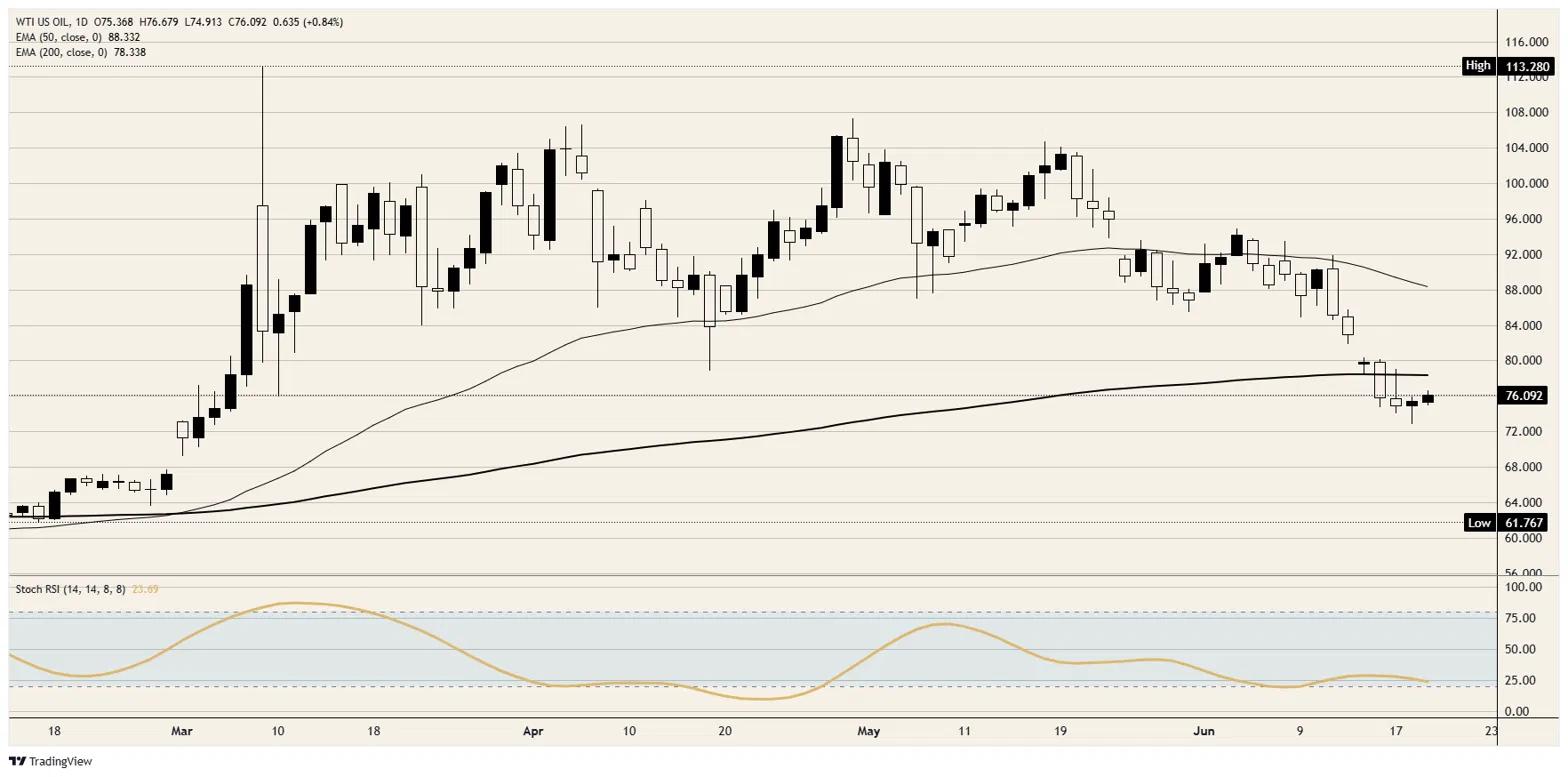
Resistance: WTI meets its first cap close to 77.00, then the 200-day Exponential Moving Average (EMA) near 78.00 to 78.50 and the round 80.00 above that; Brent is pinned right at 80.00, with its own 200 EMA around 82.50 to 83.00 the heavier barrier.
Support: WTI leans on roughly 75.00, with a deeper shelf near 74.00 should the selling resume; Brent rests on about 78.00 to 78.50, with the next marker below sitting close to 76.00.
Bias: Tactically, fade the selloff. The physical squeeze and a daily Stochastic Relative Strength Index (Stoch RSI) buried near oversold argue the down-move is stretched, favouring a recovery toward the 200 EMA on both benchmarks while WTI holds the 74.00 to 75.00 shelf. Strategically, sell the rallies: as the supply ramp completes into 2027, the building glut should cap advances and bend the curve toward the low-70s and lower. The conviction call is a floor now and a ceiling later, not a one-way trip in either direction.
WTI daily chart
WTI Oil FAQs
WTI Oil is a type of Crude Oil sold on international markets. The WTI stands for West Texas Intermediate, one of three major types including Brent and Dubai Crude. WTI is also referred to as “light” and “sweet” because of its relatively low gravity and sulfur content respectively. It is considered a high quality Oil that is easily refined. It is sourced in the United States and distributed via the Cushing hub, which is considered “The Pipeline Crossroads of the World”. It is a benchmark for the Oil market and WTI price is frequently quoted in the media.
Like all assets, supply and demand are the key drivers of WTI Oil price. As such, global growth can be a driver of increased demand and vice versa for weak global growth. Political instability, wars, and sanctions can disrupt supply and impact prices. The decisions of OPEC, a group of major Oil-producing countries, is another key driver of price. The value of the US Dollar influences the price of WTI Crude Oil, since Oil is predominantly traded in US Dollars, thus a weaker US Dollar can make Oil more affordable and vice versa.
The weekly Oil inventory reports published by the American Petroleum Institute (API) and the Energy Information Agency (EIA) impact the price of WTI Oil. Changes in inventories reflect fluctuating supply and demand. If the data shows a drop in inventories it can indicate increased demand, pushing up Oil price. Higher inventories can reflect increased supply, pushing down prices. API’s report is published every Tuesday and EIA’s the day after. Their results are usually similar, falling within 1% of each other 75% of the time. The EIA data is considered more reliable, since it is a government agency.
OPEC (Organization of the Petroleum Exporting Countries) is a group of 12 Oil-producing nations who collectively decide production quotas for member countries at twice-yearly meetings. Their decisions often impact WTI Oil prices. When OPEC decides to lower quotas, it can tighten supply, pushing up Oil prices. When OPEC increases production, it has the opposite effect. OPEC+ refers to an expanded group that includes ten extra non-OPEC members, the most notable of which is Russia.