
- Copper and other metals are exploding higher from the elevated hopes of a conflict resolution
- Profiting from the tumble in the US Dollar, the Metal is retesting its early April highs and looks to break higher
- US Dollar Index (DXY) in-depth Technical Analysis
After a rough end of April, Copper and other metals are surging today, driven by growing optimism for a clear diplomatic solution to the conflict in the Middle East.
Since early 2025 and particularly since the start of the War, the metals market is showing an unusual pattern, moving in the opposite direction of the US Dollar. In the past, metals have often served as a defensive alternative when stocks are volatile.
But since this conflict began, metals and stocks have mostly moved together, reacting strongly to changes in geopolitical tension and relief.
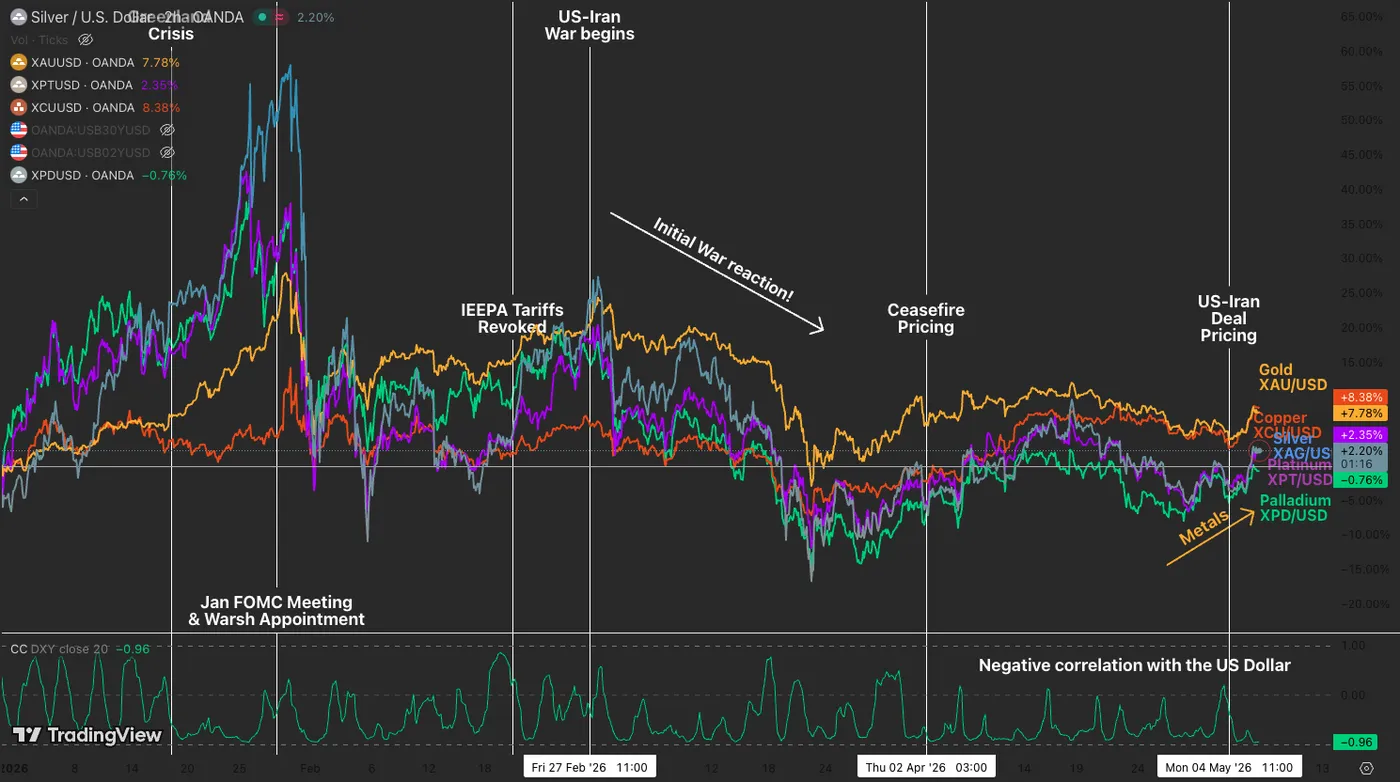
Metals Performance in 2026 and Dollar Index Correlation – Source: TradingView
Copper has been making headlines, outperforming gold at the start of the year.
Copper is benefiting from today’s sharp drop in the US Dollar. It is now retesting its early April highs and appears ready to move even higher. But, in addition to short-term correlation factors, copper is getting strong support from major long-term trends.
The growth of AI infrastructure and heavy capital spending by large tech companies are driving demand for copper, which is needed for advanced data center circuits and cooling systems.
On top of that, large investments are planned to upgrade and modernize North America’s electrical grid. All of this is fueling strong interest in copper.
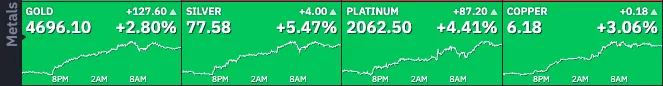
Metals Performance (15:03) – Source: TradingView. May 6, 2026
Overall, while copper is traditionally known as a highly cyclical industrial metal, standard cyclicality has simply not been dictating its recent price action.
On the contrary, these massive swings have been almost entirely explained by movements in the US Dollar. Luckily for copper bulls, the greenback is aggressively falling off the table in today’s session, removing the primary overhead headwind.
Riding this perfect storm of fundamental demand and currency weakness, prices are now actively trying to push decisively beyond the massive $6.10 high established in April.
We’ll explore a few scenarios for upcoming action in an in-depth technical analysis of Copper (XCU/USD) as the metal attempts to break resistance.
Copper (XCU/USD) Multi-Timeframe Analysis
Daily Chart
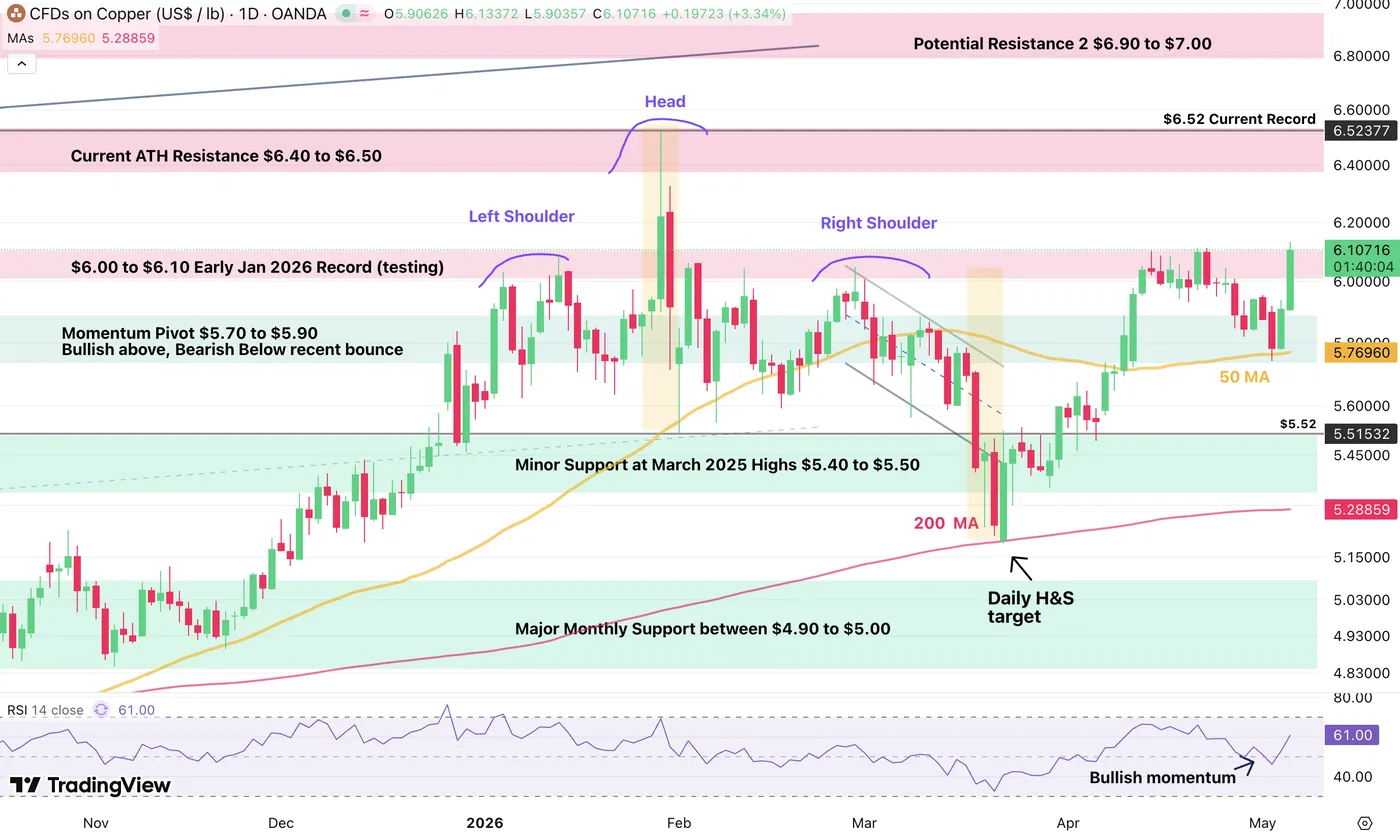
Copper (XCU/USD) Daily Chart. May 6, 2026 – Source: TradingView
After its past month’s 17% rise to $6.10, Copper could not resist the rough patch in the metals Market and pulled back close to 6% right back to its 50-Day moving average.
As seen throughout the 2025 bull trend, the asset class moves particularly strongly when reaching and breaching its Daily MAs, so this is a trend to keep your eyes on as traders.
The ongoing bounce is impressive as it erased more than two-weeks of progressive correction in two sessions, and the bull candles are now testing the key $6.10 resistance; above this, there isn’t much that can stall the move back to the all-time highs ($6.50).
4H Chart and Technical Levels
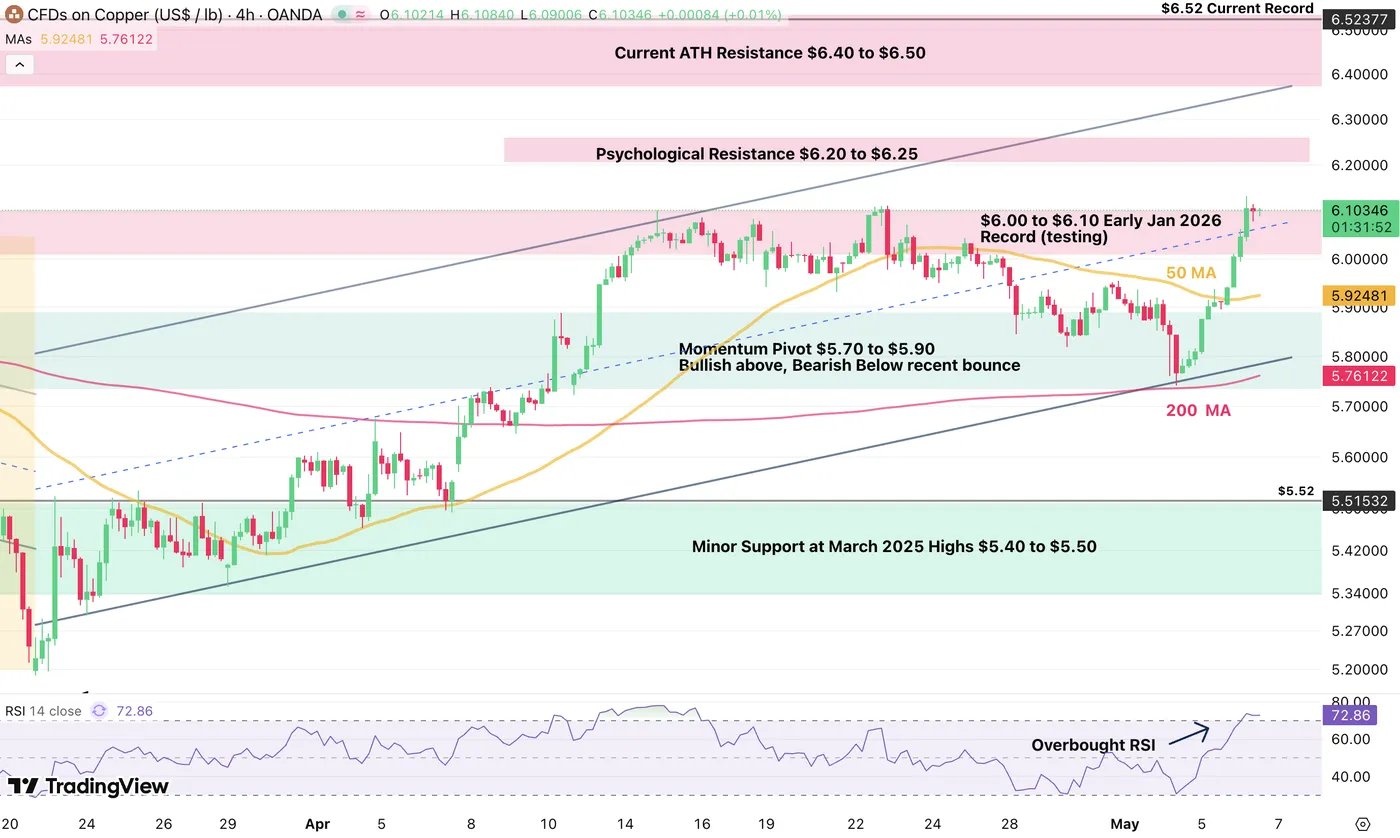
Copper (XCU/USD) 4H Chart. May 6, 2026 – Source: TradingView
The intraday action is currently forming a tight bull channel to higher levels, and with the RSI reaching overbought levels, the ongoing rally could somewhat stall.
Still, higher timeframe momentum hasn’t been so extreme yet, so this could see small consolidation which could then lead to continued upside, with the next stop at $6.20.
As mentioned in the introduction, Metals are moving on peace prospects, hence a clean deal will be awaited to confirm a continued path to all-time highs – Make sure to track the latest narratives around the peace process.
Higher Timeframe Levels to watch for Copper (XCU/USD):
Resistance Levels:
- $6.10 Early Jan 2026 and April Record (testing the upper bound)
- Psychological Resistance $6.20 to $6.25
- Current ATH Resistance $6.40 to $6.50
- $6.52 Current Record
- Potential Resistance $6.90 to $7.00
Support Levels:
- 4H 200-period MA / 50-day MA $5.76
- Momentum Pivot $5.70 to $5.90 Bullish above, Bearish Below recent bounce
- Minor Support at March 2025 Highs $5.40 to $5.50
- War lows $5.18
- 200-Day MA $5.24
- Major Monthly Support between $4.90 to $5.00
Safe Trades and keep track of the latest headlines!