
Key Highlights
- Ethereum failed to stay above $2,000 and declined heavily.
- A bearish trend line is forming with resistance at $2,000 on the daily chart of ETH/USD.
- Bitcoin price declined and settled below the $68,000 pivot zone.
- XRP also dipped over 5% and traded below $1.18.
Ethereum Technical Analysis
Ethereum attempted an upside break above $2,200 but failed. ETH started a fresh decline and traded below the $2,000 support.
Looking at the daily chart, the price failed to stay above the 76.4% Fib retracement level of the recovery wave from the $1,739 swing low to the $2,462 high. The price also settled below the 100-day simple moving average (red).
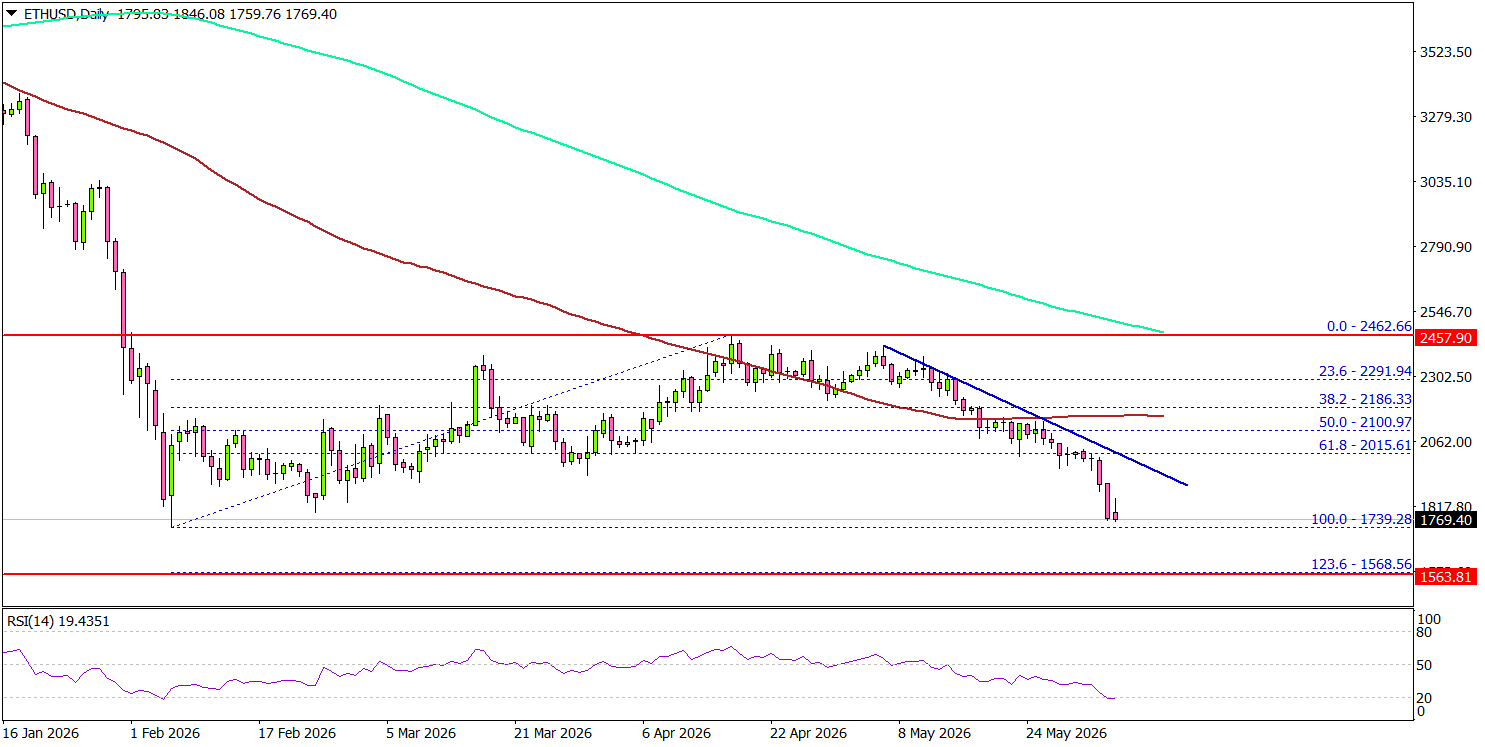
On the downside, the bulls might be active near $1,720 and $1,700. Any more losses might call for a move toward $1,650. The main support could be $1,565 or the 1.236 Fib extension level of the recovery wave from the $1,739 swing low to the $2,462 high.
On the upside, the bears might remain active near $1,880. The first key resistance could be near the $1,920 level. The main hurdle for bulls sits near $2,000.
A close above the $2,000 level could open doors for a larger upward movement. In the stated case, ETH could rise toward $2,200.
Looking at Bitcoin, the price failed to continue higher, trimmed gains, and is now struggling below the $68,000 support zone.
Economic Releases
- US Initial Jobless Claims – Forecast 213K, versus 215K previous.