The US Dollar Index (DXY) fell toward the 97.90 region on Friday, pressured by improving risk sentiment and easing safe-haven demand after reports suggested the United States (US) and Iran are still attempting to preserve a fragile ceasefire framework despite renewed military incidents in the Middle East.
Market sentiment improved after US President Donald Trump stated that negotiations remain active and that both sides are trying to avoid a broader escalation around the Strait of Hormuz. The softer geopolitical tone reduced demand for the US Dollar (USD), allowing risk-sensitive currencies to recover ground. At the same time, Oil prices trimmed part of their gains, helping ease fears of another major inflation shock.
The latest US Nonfarm Payrolls (NFP) report revealed that the US economy added 115,000 jobs in April, surpassing market expectations of around 60,000. The Unemployment Rate remained stable at 4.3%. However, Average Hourly Earnings showed a monthly slowdown, strengthening the belief that inflation pressures may continue to ease, even as the labor market stays resilient.
Additional downward pressure on the US Dollar emerged after the University of Michigan Consumer Sentiment survey experienced a sharp decline, reflecting households’ concerns about inflation and economic uncertainty. Meanwhile, Treasury yields also decreased, contributing to the softer tone of the USD.
US Dollar Price Today
The table below shows the percentage change of US Dollar (USD) against listed major currencies today. US Dollar was the strongest against the Canadian Dollar.
| USD | EUR | GBP | JPY | CAD | AUD | NZD | CHF | |
|---|---|---|---|---|---|---|---|---|
| USD | -0.45% | -0.50% | -0.19% | 0.13% | -0.49% | -0.42% | -0.51% | |
| EUR | 0.45% | -0.08% | 0.26% | 0.57% | -0.05% | 0.07% | -0.04% | |
| GBP | 0.50% | 0.08% | 0.34% | 0.65% | 0.02% | 0.14% | 0.03% | |
| JPY | 0.19% | -0.26% | -0.34% | 0.32% | -0.33% | -0.22% | -0.31% | |
| CAD | -0.13% | -0.57% | -0.65% | -0.32% | -0.65% | -0.54% | -0.63% | |
| AUD | 0.49% | 0.05% | -0.02% | 0.33% | 0.65% | 0.12% | 0.00% | |
| NZD | 0.42% | -0.07% | -0.14% | 0.22% | 0.54% | -0.12% | -0.11% | |
| CHF | 0.51% | 0.04% | -0.03% | 0.31% | 0.63% | -0.01% | 0.11% |
The heat map shows percentage changes of major currencies against each other. The base currency is picked from the left column, while the quote currency is picked from the top row. For example, if you pick the US Dollar from the left column and move along the horizontal line to the Japanese Yen, the percentage change displayed in the box will represent USD (base)/JPY (quote).
EUR/USD is trading near the 1.1780 region, benefiting from the weaker USD as traders continue to monitor expectations for the European Central Bank (ECB). Markets remain attentive to whether persistent energy-price volatility could delay future rate cuts in the Eurozone.
GBP/USD surged near the 1.3620 area, supported by the broad USD pullback and relatively stable United Kingdom (UK) economic expectations. However, upside momentum remains cautious as traders continue assessing geopolitical developments and global growth risks.
USD/JPY is falling toward the 156.60 zone, with the Japanese Yen (JPY) strengthening amid lower US Treasury yields. Safe-haven demand for the Yen remains active amid lingering uncertainty surrounding Middle East tensions and global trade routes.
AUD/USD is rising near the 0.7240 region, supported by improving market sentiment and reduced demand for the Greenback. The Australian Dollar (AUD) also found support after investors welcomed signs that geopolitical tensions may not escalate further in the immediate term.
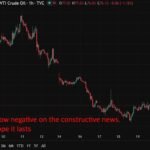
West Texas Intermediate (WTI) Oil prices are retreating from recent highs but remain elevated above $95.30 per barrel as markets remain cautious about the continued halt of tankers through the Strait of Hormuz.
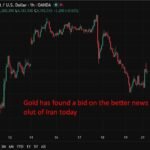
Gold prices are holding firm near $4,720, supported by lingering geopolitical uncertainty and lower US yields, although easing safe-haven flows are limiting stronger upside momentum.
Central banks’ meetings and upcoming data releases to shape
Monday, May 11:
- CN April CPIs; CN April PPI YoY
- US April Existing Home Sales Change MoM
- UK April BRC Like-For-Like Retail Sales YoY
Tuesday, May 12:
- AU May Westpac Consumer Confidence
- EU April HICPs
- DE May ZEW Survey Current Situation; DE May ZEW Survey Economic Sentiment
- AU Budget Release
- US ADP Employment Change 4-week average
- US April CPIs; US April Core CPIs
- US April Monthly Budget Statement
- JP March Current Account n.s.a.
Wednesday, May 13:
- AU Q1 Wage Price Index QoQ
- NZ Q2 RBNZ Inflation Expectations QoQ
- FR April CPI EU norm YoY
- EU Q1 Employment Change QoQ Prel
- EU Q1 GDP s.a. QoQ Prel; EU Q1 GDP s.a. YoY Prel
- EU March Industrial Production s.a. MoM
- US April PPIs; US April Core PPIs
Thursday, May 14:
- AU May Consumer Inflation Expectations
- UK March GDP MoM; UK Q1 GDP QoQ Prel; UK Q1 GDP YoY Prel
- UK March Industrial Production MoM; UK March Manufacturing Production MoM
- DE April HICP YoY
- US Initial Jobless Claims
- US April Retail Sales MoM; US April Retail Sales Control Group; US April Retail Sales ex Autos MoM
- NZ April Business NZ PMI
Friday, May 15:
- FR April CPI EU norm YoY; FR April CPI YoY
- US May NY Empire State Manufacturing Index
- US April Industrial Production MoM
Anticipating economic perspectives: Voices on the horizon
Monday, May 11:
Tuesday, May 12:
- Fed’s Williams speech
- ECB’s Elderson speech
- Fed’s Goolsbee speech
Wednesday, May 13:
- BoE’s Mann speech
- Fed’s Kashkari speech
- ECB’s Lane speech
- ECB’s President Lagarde speech
Thursday, May 14:
- ECB’s President Lagarde speech
- Fed’s Schmid speech
- Fed’s Hammack speech
- Fed’s Williams speech
- Fed’s Barr speech
WTI Oil FAQs
WTI Oil is a type of Crude Oil sold on international markets. The WTI stands for West Texas Intermediate, one of three major types including Brent and Dubai Crude. WTI is also referred to as “light” and “sweet” because of its relatively low gravity and sulfur content respectively. It is considered a high quality Oil that is easily refined. It is sourced in the United States and distributed via the Cushing hub, which is considered “The Pipeline Crossroads of the World”. It is a benchmark for the Oil market and WTI price is frequently quoted in the media.
Like all assets, supply and demand are the key drivers of WTI Oil price. As such, global growth can be a driver of increased demand and vice versa for weak global growth. Political instability, wars, and sanctions can disrupt supply and impact prices. The decisions of OPEC, a group of major Oil-producing countries, is another key driver of price. The value of the US Dollar influences the price of WTI Crude Oil, since Oil is predominantly traded in US Dollars, thus a weaker US Dollar can make Oil more affordable and vice versa.
The weekly Oil inventory reports published by the American Petroleum Institute (API) and the Energy Information Agency (EIA) impact the price of WTI Oil. Changes in inventories reflect fluctuating supply and demand. If the data shows a drop in inventories it can indicate increased demand, pushing up Oil price. Higher inventories can reflect increased supply, pushing down prices. API’s report is published every Tuesday and EIA’s the day after. Their results are usually similar, falling within 1% of each other 75% of the time. The EIA data is considered more reliable, since it is a government agency.
OPEC (Organization of the Petroleum Exporting Countries) is a group of 12 Oil-producing nations who collectively decide production quotas for member countries at twice-yearly meetings. Their decisions often impact WTI Oil prices. When OPEC decides to lower quotas, it can tighten supply, pushing up Oil prices. When OPEC increases production, it has the opposite effect. OPEC+ refers to an expanded group that includes ten extra non-OPEC members, the most notable of which is Russia.