


Key Highlights
- GBP/USD started a recovery wave above the 1.3400 resistance.
- A rising channel is forming with support at 1.3440 on the 4-hour chart.
- EUR/USD is struggling to clear the 1.1675 resistance zone.
- WTI crude oil prices dipped below the $96.50 support.
GBP/USD Technical Analysis
The British Pound found support near 1.3300 against the US Dollar. GBP/USD formed a base and started a steady increase above the 1.3380 resistance.
Looking at the 4-hour chart, the pair traded above the 50% Fib retracement level of the downward move from the 1.3653 swing high to the 1.3302 low. There is also a rising channel forming with support at 1.3440.
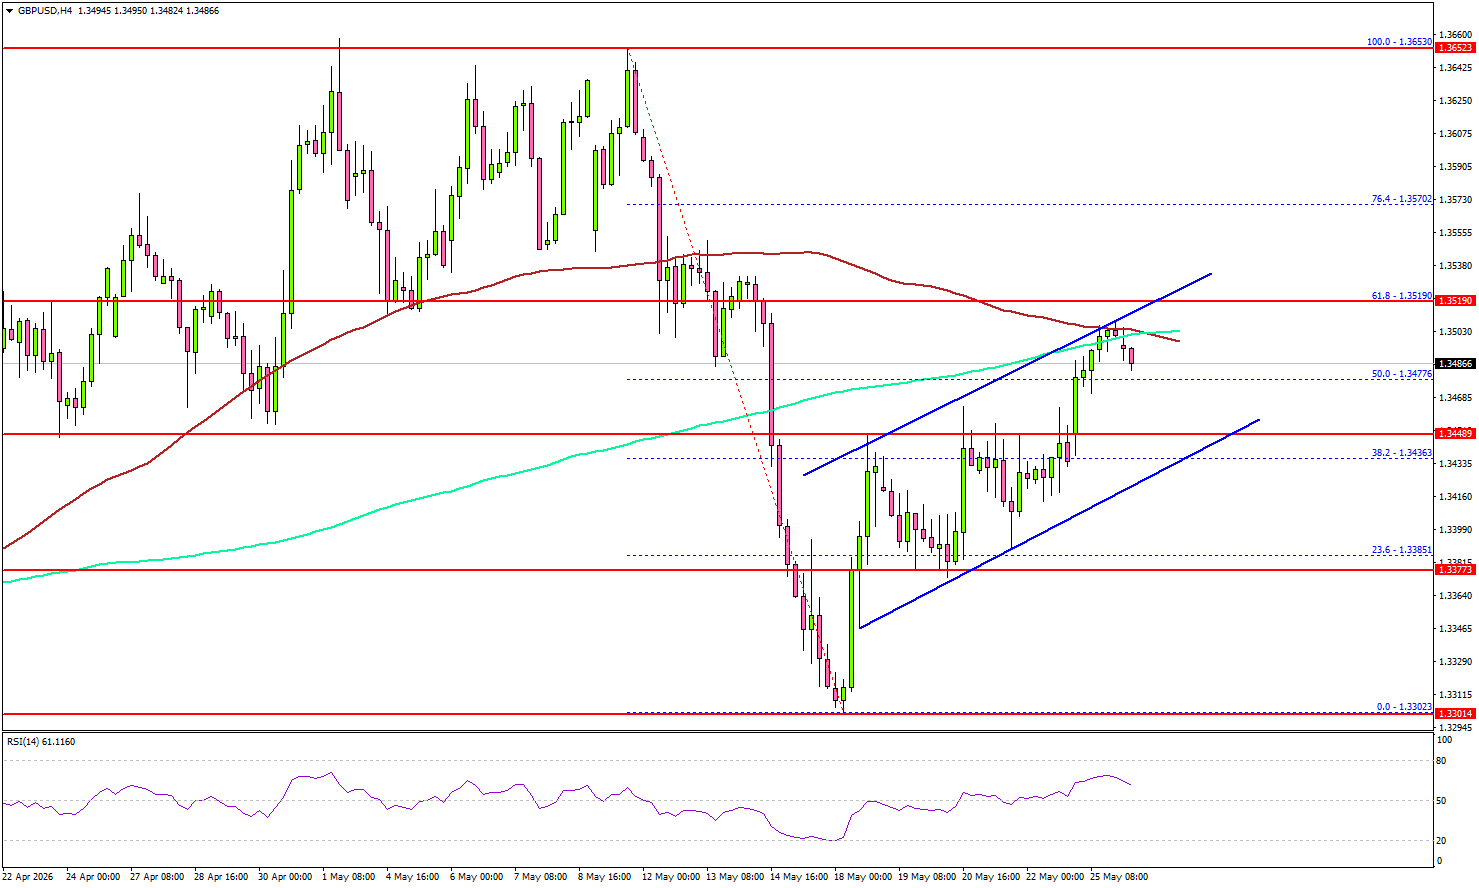
However, the pair is now facing hurdles near 1.3500, the 100 simple moving average (red, 4-hour), and the 200 simple moving average (green, 4-hour).
The next major resistance could be 1.3520 and the 61.8% Fib retracement level of the downward move from the 1.3653 swing high to the 1.3302 low. A close above 1.3520 could open doors for gains above 1.3550. In the stated case, the bulls could aim for a move to 1.3600.
If there is another decline, the pair could find bids near 1.3440. The first major support sits near the 1.3420 level. The next support could be 1.3400. A close below 1.3400 might initiate a drop to 1.3350. Any more losses might open the doors for a drop toward the 1.3300 zone.
Looking at EUR/USD, the pair is attempting to recover some losses but the bears are active below the 1.1675 resistance.
Upcoming Key Economic Events:
- US Housing Price Index for March 2026 (MoM) – Forecast +0.1%, versus 0% previous.