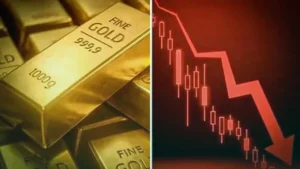
Gold prices have retreated to the 4,033 USD per ounce level, marking a persistent slide that has traders recalibrating their exposure to precious metals. The recent downtrend is being driven by a complex interplay between shifting geopolitical risks and evolving inflation expectations, forcing market participants to weigh the metal’s traditional safe-haven status against the tightening grip of central bank policy.
For active traders, the current environment is defined by a dichotomy: while domestic US inflation indicators have recently trended toward the downside, external pressures—specifically the volatility in global energy markets—are threatening to reverse these gains. Understanding this friction is essential, as the geopolitical landscape in the Middle East has introduced a new layer of uncertainty that could fundamentally shift the trajectory of interest rate expectations.
Key Market Drivers
The primary catalyst currently weighing on gold is the sudden surge in oil prices, which serves as a proxy for broader inflation fears. The escalation of military hostilities between the United States and Iranian-linked targets has strained regional stability, effectively nullifying the benefits of the interim peace agreements established just last month. When energy prices climb due to supply-side security concerns, the market naturally anticipates a more hawkish stance from central banks to combat imported inflation, which inherently diminishes the appeal of non-yielding assets like gold.
While June producer price index (PPI) data and softer consumer inflation figures provided a temporary tailwind, the market is already looking past these historical prints. Because these data points were recorded before the most recent flare-up in regional conflict, investors are wary that the next cycle of economic data may reflect a supply-chain disruption. The market is effectively pricing in a higher risk premium for inflation, which creates a challenging backdrop for a sustained recovery in gold prices.
Trader Takeaways
- Monitor energy sector volatility as a primary leading indicator for gold; rising oil prices currently suppress precious metal demand.
- Distinguish between lagged economic data and current geopolitical realities; prior inflation cooling may not persist if energy costs remain elevated.
- Utilize technical confirmation tools, such as the MACD and Stochastic oscillators, to gauge the strength of the current downward momentum.
- Exercise caution with counter-trend long positions until the current consolidation range clearly breaks above established resistance.
- Focus on risk management, as the renewed US-Iran conflict creates “gap-risk” potential that could trigger sharp intraday price fluctuations.
Levels and Signals to Watch
From a technical perspective, the market is navigating a critical consolidation phase around the 4,060 USD mark. Recent price action has confirmed a bearish structure, with the H4 timeframe showing a decline toward the 4,015 USD level. The MACD indicator remains a key monitorable; its position below the centerline with a downward trajectory suggests that the path of least resistance remains to the downside. If momentum persists, the market is targeting the 3,920 USD support level. Conversely, should the asset find a foothold, any corrective bounce would need to reclaim 4,055 USD and eventually 4,150 USD to invalidate the current bearish technical bias. On the H1 chart, a breach below 4,012 USD would serve as a confirmation of further weakness, underscored by Stochastic readings currently under heavy pressure toward the 20 level.
Cross-Asset Context
The current movement in gold highlights the negative correlation between geopolitical instability and the precious metals market when such instability triggers inflation fears. While gold is historically viewed as a hedge, its current price action shows that when energy prices rise, the DXY and rates-sensitive assets often dictate short-term direction. Investors should keep a close watch on the relationship between oil and bond yields; if higher energy prices lead to a sustained rise in yields, the downward pressure on gold will likely intensify as the opportunity cost of holding the metal increases relative to other asset classes.