The Nasdaq-100 has demonstrated a significant technical reversal, bouncing firmly off a critical support confluence to signal a potential shift in momentum. For forex traders, this move in major equity indices serves as a vital barometer for broader risk sentiment, directly influencing demand for safe-haven currencies and high-beta assets across the FX landscape.
As the index breaks away from its recent floor, market participants are shifting their focus toward the next tactical resistance objective. Understanding the mechanics of this recovery is essential, as the interplay between equity volatility and currency fluctuations remains the primary engine driving liquidity allocation in the current macroeconomic environment.
Key Market Drivers
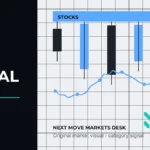
The recent price action in the Nasdaq-100 is rooted in a technically significant support zone located near the 27000.00 level. This area is particularly relevant for institutional participants, as it aligns with previous price floors established in April, the lower extremity of the daily Bollinger Band, and a 61.8% Fibonacci retracement of the upward impulse that originated in the second quarter. The confluence of these technical indicators acted as a catalyst for a Bullish Engulfing Japanese candlestick pattern on the daily chart, which has served to confirm the initiation of a new upward impulse wave.
From a liquidity perspective, the reversal suggests that buyers are stepping in to defend the established uptrend, effectively invalidating short-term bearish exhaustion. As the broader market absorbs the implications of this price action, the index is positioning itself for a tactical climb toward the 29200.00 resistance level. This recovery reflects a broader risk-on sentiment that typically places downward pressure on the U.S. Dollar (DXY) as investors rotate capital back into growth-oriented equity assets.
Trader Takeaways
- The Bullish Engulfing pattern on the daily timeframe provides a strong structural signal of a shift in momentum from the 27000.00 support zone.
- Traders should recognize that the index is currently operating within a clear daily uptrend, prioritizing long-side setups until price action suggests otherwise.
- The 29200.00 level stands as the primary target for profit-taking or the assessment of structural continuation.
- Monitoring the health of this equity-led rally is crucial for anticipating correlations in currency markets, particularly regarding the USD/JPY and AUD/USD pairs, which often track equity sentiment.
- Risk management should be anchored to the validity of the 27000.00 floor; a failure to hold this zone could signal a deeper consolidation phase.
Levels and Signals to Watch
The primary focal point for market participants remains the 27000.00 support region. A decisive close below this level would invalidate the current bullish structure and potentially shift the outlook toward a retest of lower support thresholds. Conversely, upside momentum is expected to accelerate as the index approaches the 29200.00 resistance. Traders should observe the velocity of the move as it tests this upper boundary, as a lack of buying volume near this level could lead to a range-bound environment. Volatility-sensitive traders should be aware that momentum indicators are currently confirming the impulse wave, suggesting that pullbacks within this trend may offer better risk-to-reward entries for those looking to participate in the move toward 29200.00.
Cross-Asset Context
The strength of the Nasdaq-100 is inextricably linked to the performance of the U.S. Dollar. A rise in tech equities typically coincides with a tempering of demand for the DXY, as risk appetite encourages capital flow into higher-yield assets. When the Nasdaq demonstrates consistent gains, it often pressures the greenback, thereby providing a tailwind for major currencies such as the Euro and the British Pound. Furthermore, if this equity trend continues, look for potential decoupling in gold prices, which often struggle to gain momentum when indices like the Nasdaq-100 are experiencing strong upward impulse waves.
Risk Context
While the current technical structure points toward further upside, Next Move Markets editorial desk reminds traders that market environments are highly susceptible to sudden shifts in macro sentiment. Relying solely on technical patterns without consideration of broader central bank policy or unexpected volatility spikes can lead to overconfidence. The Bullish Engulfing signal is a powerful tool, but it is not a guarantee of future performance. Traders should remain disciplined, ensuring that stops are placed logically to protect against sudden reversals that could occur if broader index sentiment deteriorates or if external macro shocks force a deleveraging event across global equity markets.
Editorial note: This article is market intelligence for educational purposes and is not investment advice.
Next Move Markets desk view
For active traders, this brief should be read through the lens of currency markets rather than as a standalone headline. The key question is whether the theme behind Nasdaq 100 Technical Outlook and Current Wave Trend Analysis can influence positioning beyond the first reaction. That means watching central-bank expectations, yield differentials, dollar momentum and risk appetite together, not in isolation.
A richer trading read comes from separating the catalyst from confirmation. The catalyst explains why markets are paying attention; confirmation comes from price action, liquidity and cross-asset behavior after the headline is digested. If those signals do not align, traders should treat the move as fragile and keep risk tighter.
What traders should watch next
- Whether the move is confirmed by the U.S. dollar index and short-term rate expectations.
- How London and New York liquidity react once the initial headline risk is absorbed.
- Whether price action respects the latest support and resistance zones instead of fading immediately.
- Any follow-up comments from central-bank officials or data releases that change the rate path.
Risk context
This article is a market-intelligence brief, not a trade recommendation. Before acting on the theme, traders should define invalidation, position size and the time horizon of the setup. The same headline can support a short-term reaction and still fail as a multi-session trend if liquidity, policy expectations or broader sentiment move the other way.
Scenario map
The base case is that traders keep this theme on the radar while waiting for confirmation from central-bank expectations, yield differentials, dollar momentum and risk appetite. A stronger continuation scenario requires follow-through after the first reaction, preferably with related assets moving in the same direction. A failure scenario develops if the headline is quickly absorbed, volatility fades and price returns inside the previous range.
For currency markets, the most useful approach is to compare the article theme with live market behavior. If the market confirms the narrative, pullbacks can become more constructive. If the market rejects it, the headline becomes background noise rather than a trading driver.
Execution discipline
- Define the level first: traders should know where the idea is invalidated before thinking about upside or downside.
- Separate news from setup: Nasdaq 100 Technical Outlook and Current Wave Trend Analysis may explain attention, but entry quality still depends on timing, liquidity and risk/reward.
- Watch confirmation: a clean move usually appears across related markets, not only in one isolated instrument.
- Control exposure: if volatility expands, smaller position sizing can be more professional than chasing the headline.
Next Move Markets treats this kind of brief as a starting point for preparation: identify the driver, map the scenarios, then wait for the market to prove which path is actually being priced.