Silver has officially entered what looks to be a real breakout.
As we noted in our Friday analysis, the metals sector was overdue for a rally, and that move is now underway. Silver has attracted strong buying and has surged past the key $85 level to start the week, up 7% on the session.
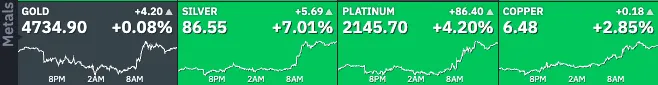
Daily Metal Performance, May 11, 2026. Source: Finviz.
The macroeconomic environment is changing. In recent weeks, if not months now, geopolitical headlines have stopped driving daily moves in most risk assets, and precious commodities were not isolated.
Metals were hit hard at first by conflict and rate-hike fears, but while that link has not disappeared, it is fading.
Energy is now the only asset class still reacting to news coming from the Middle East, mostly because of supply issues in Hormuz and the lack of a ceasefire agreement.
One of the most interesting parts of this breakout is the fact that Silver is moving higher without help from gold, which usually sets the direction for the alternative asset class.
Normally, silver follows Gold’s moves, but this time, the strong bounce suggests there is real demand and strong buying interest focused on alternative metals instead.
Traders could also be responding to China’s higher inflation report from yesterday, which suggests its inflation, a shortcut for economic activity after deflationary trends, is starting to recover.
Silver and Copper are not just precious metals; they are mainly industrial metals.
When China, the world’s largest industrial producer, shows stronger economic activity, it usually means demand for these metals is rising.
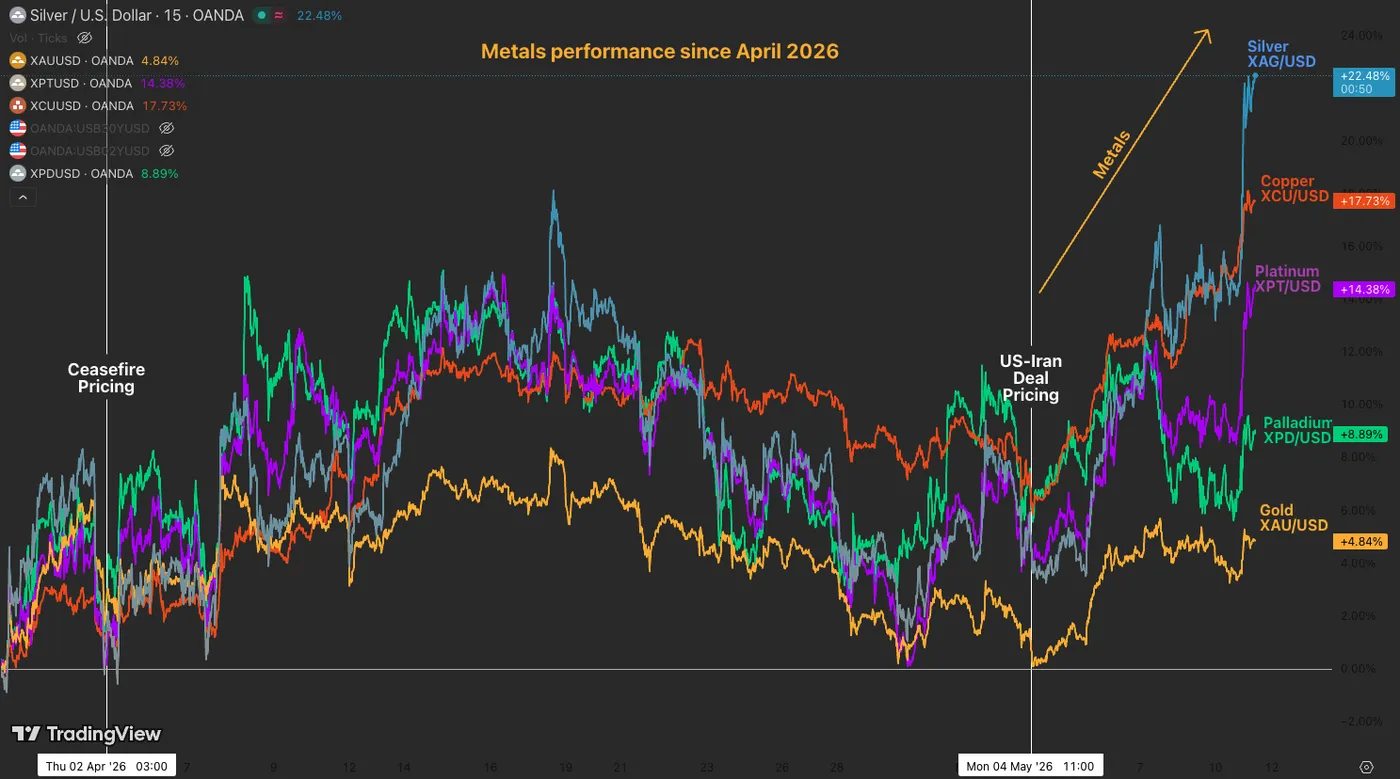
Metals performance since April 2026. Source: TradingView, May 11, 2026.
We will dive into a Silver two-timeframe intraday analysis to prepare for the heavy action unfolding in front of our eyes. Is this a breakout?
Let’s get right into it.
Silver (XAG/USD) Intraday Timeframe Technical Analysis
4H Chart and Technical Levels
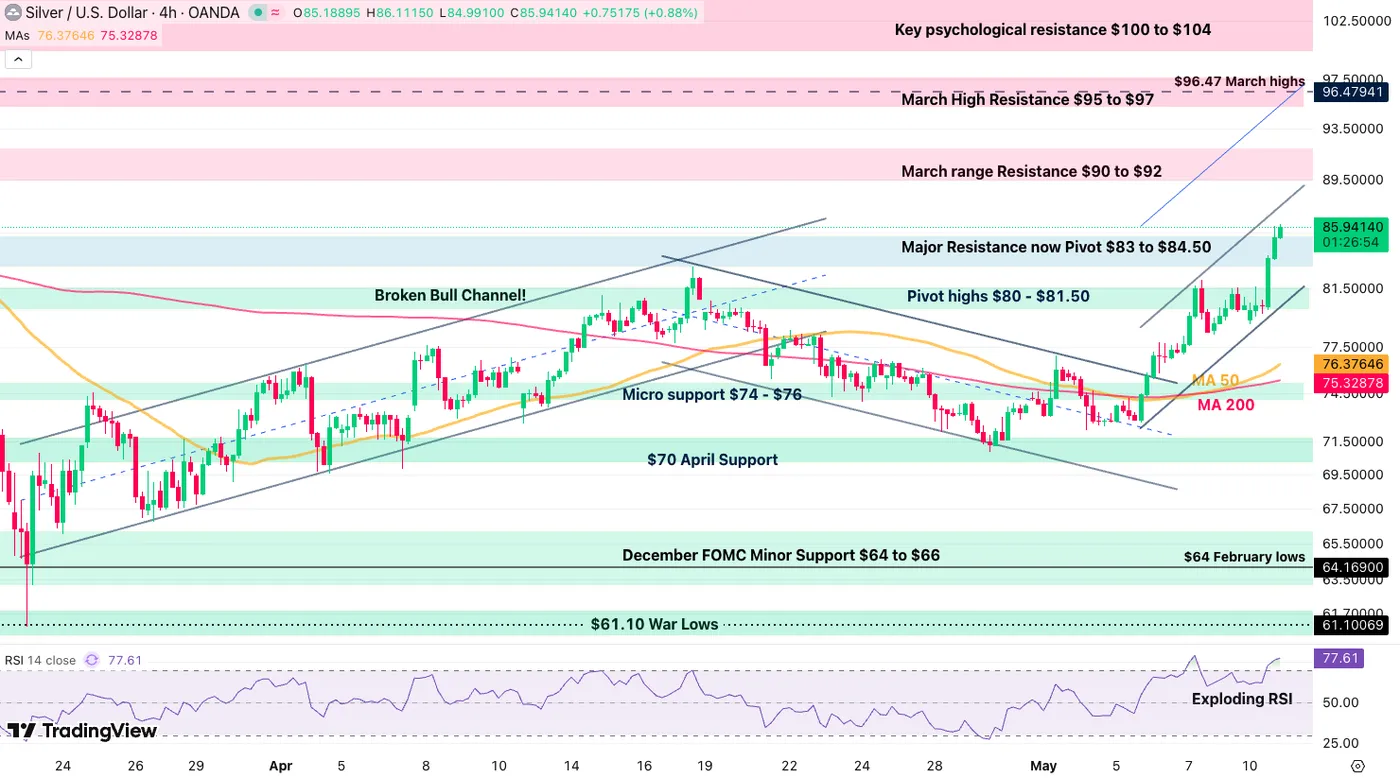
Silver 4H Chart, May 11, 2026. Source: TradingView.
After forming a bullish weekly divergence, the action is now turning much more bullish, and this translated into a break of the prior $83 to $84.50 resistance, now acting as a key momentum pivot.
Evolving into a steep bull channel, the move should trigger high volatility in the coming days.
Without many resistance levels until then, bulls should remain in control until $90, a level to be closely monitored.
Levels to watch for Silver (XAG) trading:
Resistance Levels:
- March range resistance: $90 to $92
- March high resistance: $95 to $97
- Key psychological resistance: $100 to $104
- All-time highs: $121
Support Levels:
- Major resistance now pivot: $83 to $84.50
- Pivot highs: $80 to $81.50
- Pivot lows: $74.50 to $75
- $61.10 war lows
1H Chart
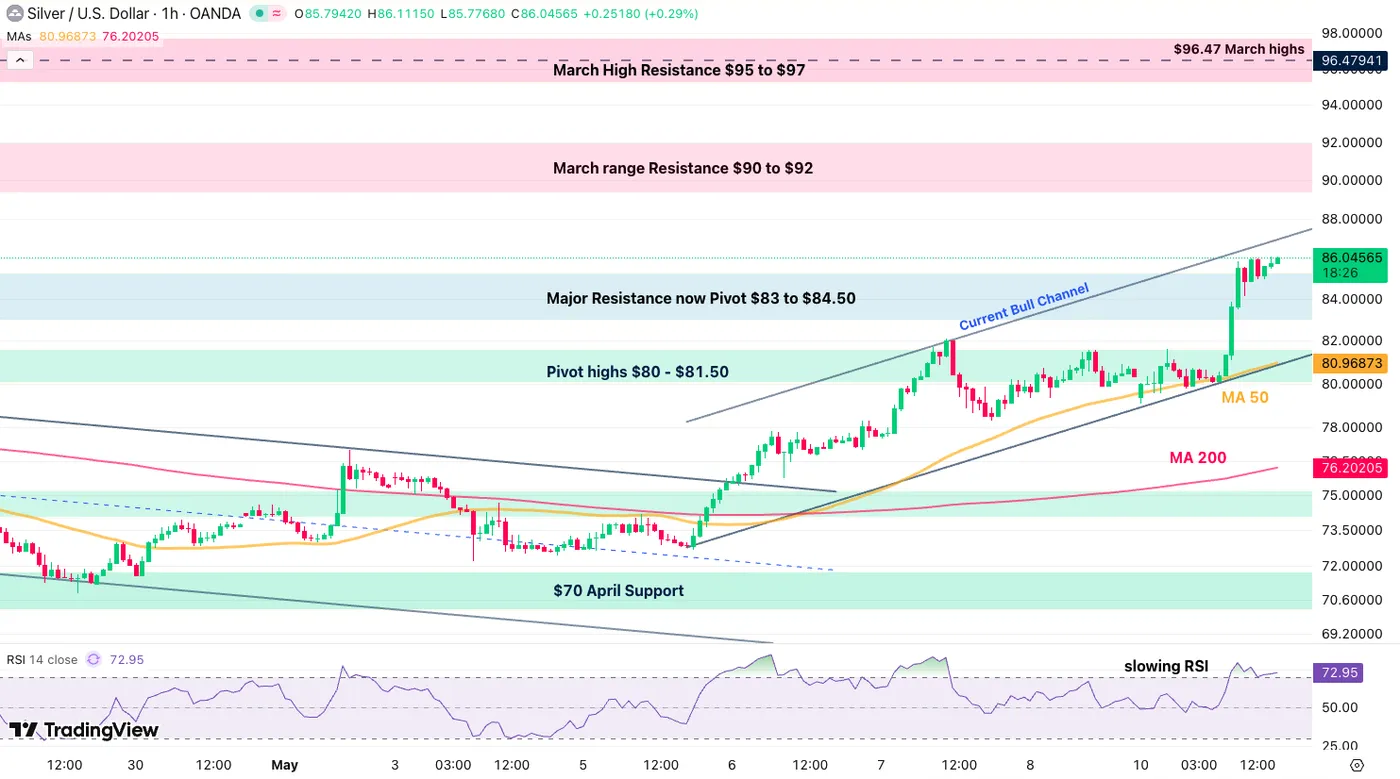
Silver 1H Chart, May 11, 2026. Source: TradingView.
Looking at the 1H candle points to clearer action ahead, with the morning extension now pointing to a slowing in the buying due to the overbought RSI.
The fact that the action did not pull back, however, translates into buyers not giving up their freshly gained advantage.
Check out reactions to the channel top, around $86.50.
For late bulls, watch out for overbought conditions. To do so, either wait for a continued explosion with a buy stop above $87 or a pullback to $81.50 to $82.
Safe trades.