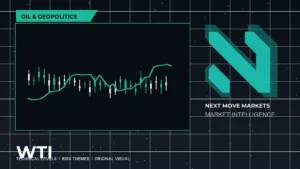
WTI crude oil has entered a decisive upward trajectory, signaling a significant shift in trend dynamics. By clearing established overhead supply, the commodity has transitioned into a more aggressive expansion phase, catching the attention of momentum-focused traders looking for sustained directional movement in the energy sector.
This surge is particularly critical because it confirms the development of an intermediate impulse wave originating from July lows. As the market moves past consolidation, the focus shifts toward potential upside targets, necessitating a reassessment of risk and reward profiles for active participants currently positioned in energy futures or related equities.
Key Market Drivers
The primary catalyst for this move is the structural breakout from a high-stakes congestion zone situated between the 80.00 psychological barrier and the 38.2% Fibonacci retracement level derived from the March downward impulse. For months, the 80.00 level acted as a formidable support floor before transitioning into a stiff resistance ceiling. The successful breach of this area signals that buyers have absorbed the supply that previously constrained price action.
Technically, the current momentum is categorized as impulse wave 3, a phase typically associated with increased market participation and accelerating velocity. By clearing this bottleneck, the market has validated the intermediate-term bullish thesis, suggesting that the broader corrective cycle seen earlier in the spring has lost its downward force. Liquidity is likely flowing toward this breakout as short-sellers cover positions and momentum traders join the trending move.
Trader Takeaways
- The breakout of the 80.00 resistance zone serves as a primary buy signal, confirming a shift from corrective consolidation to active impulse.
- The current trend structure indicates a continuation pattern, with impulse wave 3 providing the necessary force to push toward higher resistance horizons.
- Risk management should be prioritized around the breakout point, as a failed retest of the 80.00 level would invalidate the immediate bullish thesis.
- Active traders should monitor for signs of exhaustion or divergence as the price approaches the 90.00 objective to avoid holding through potential wave completion pullbacks.
- Position sizing should reflect the increased volatility inherent in impulse wave formations, which often feature sharp, rapid moves.
Levels and Signals to Watch
The immediate technical objective is firmly set at the 90.00 resistance level. This price point represents the projected completion of the current wave 3 sequence. Traders should watch for how price interacts with this level; a clean rejection could signal a temporary peak, while a breakout above 90.00 would suggest an extension of the current impulse, potentially inviting further upside momentum.
Conversely, the 80.00 level has now inverted its role; it must hold as support for the current narrative to remain intact. If the price fails to maintain this area and slips back into the previous congestion range, it would signal a possible failure of the impulse wave, forcing a move back toward the structural lows of the July cycle. Momentum indicators should be monitored for signs of overextension, although during a primary impulse wave, momentum often remains elevated for longer than traditional oscillators might suggest.
Cross-Asset Context
Crude oil’s breakout often creates a ripple effect across the broader financial landscape. Strength in WTI typically influences inflation expectations and can weigh on energy-intensive sectors within equity markets, such as transportation and logistics. Furthermore, because oil is priced in U.S. Dollars, traders should keep a close eye on the DXY (Dollar Index). Generally, a strong correlation exists where oil rallies can be dampened by a strengthening dollar, though the current impulse suggests that supply-demand dynamics are currently overriding broader currency headwinds.