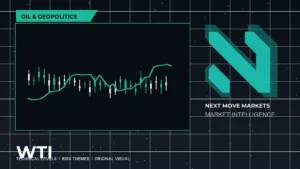
WTI Crude Oil has encountered a significant technical barrier, triggering a reversal that signals a potential shift in short-term momentum. After a period of upward movement, the asset faced intense selling pressure at a critical confluence zone, halting the recovery trend that began earlier in the month.
For active traders, this reversal is a pivotal development as it marks a transition from a corrective rally back toward primary support zones. Understanding how the market reacts to this rejection is essential, as the inability to break through historical resistance points often indicates a broader exhaustion of buying power and a high probability of a retest of previous support levels.
Key Market Drivers
The recent price action in WTI Crude Oil is driven by a confluence of technical factors that have created a ceiling for further gains. The resistance zone, situated at the 90.00 level, serves as a major psychological and structural threshold. This specific price point previously acted as a robust support level during May, illustrating the classic market phenomenon where former support transforms into future resistance. The downward pivot was further reinforced by technical indicators, specifically the upper daily Bollinger Band, which often signals overextended bullish conditions, and the 61.8% Fibonacci retracement level of the downward impulse initiated in May.
Trader Takeaways
- Monitor the rejection at the 90.00 resistance zone as a confirmation of renewed downward pressure.
- The conclusion of the minor impulse wave originating in early July suggests that the market is currently transitioning into a corrective or bearish phase.
- Short positions may find structural justification following the failure to maintain momentum above the Fibonacci retracement level.
- Risk management should be prioritized, as reversals from high-conviction resistance zones can experience rapid volatility.
- The 75.00 level serves as the primary downside target, representing a significant technical floor that acted as resistance earlier in the month.
Levels and Signals to Watch
The current technical landscape suggests a path of least resistance toward the south. The critical resistance level remains firmly anchored at 90.00. Should the price attempt a recovery, the 90.00 zone must be reclaimed and consolidated above to invalidate the current bearish thesis. Traders should look for sustained volume behind any downward move to confirm the breakdown of recent minor support levels.
On the downside, the 75.00 level is the focal point for bears. This was previously a key resistance point at the start of July and is expected to attract significant buy-side interest. A breach of 75.00 would likely signal a more profound continuation of the downward trend established in May. Investors should watch for price consolidation or potential bounces at this level to determine whether it will act as a launchpad for a recovery or if further liquidity runs below the level are imminent.
Cross-Asset Context
Commodities, particularly oil, often trade with a high correlation to broader market sentiment and the strength of the energy sector within global indices. When WTI Crude Oil faces such a clear technical rejection, it often ripples through energy equities and impacts inflation-sensitive assets. Traders should remain alert to how this move in oil affects the DXY, as energy prices frequently maintain an inverse relationship with the dollar, influencing macro volatility across commodities and broader risk assets.
Risk Context
While the technical outlook favors a decline, market participants must guard against overconfidence. Trends in the energy sector can be rapidly altered by geopolitical news, inventory data, or shifts in supply-demand forecasts. A reversal of this magnitude is a high-probability setup, but “false breaks” can occur if market sentiment shifts suddenly. Traders should utilize stop-loss orders placed above the 90.00 resistance area to protect against sudden volatility spikes that could negate the current setup. Maintaining a cautious, objective view of how the market behaves as it approaches the 75.00 support level is vital for managing trade execution in volatile conditions.
Editorial note: This article is market intelligence for educational purposes and is not investment advice.
Next Move Markets desk view
For active traders, this brief should be read through the lens of energy markets rather than as a standalone headline. The key question is whether the theme behind WTI Crude Oil Technical Outlook: Identifying Key Price Trend Reversals can influence positioning beyond the first reaction. That means watching supply headlines, inventory data, OPEC policy, transport routes and geopolitical risk together, not in isolation.
A richer trading read comes from separating the catalyst from confirmation. The catalyst explains why markets are paying attention; confirmation comes from price action, liquidity and cross-asset behavior after the headline is digested. If those signals do not align, traders should treat the move as fragile and keep risk tighter.
What traders should watch next
- Whether the headline changes physical supply expectations or only short-term sentiment.
- How Brent and WTI react around recent technical ranges after the first volatility spike.
- Inventory data, OPEC communication and shipping-route risk that can confirm the theme.
- Currency moves and global growth expectations that may offset energy-specific catalysts.
Risk context
This article is a market-intelligence brief, not a trade recommendation. Before acting on the theme, traders should define invalidation, position size and the time horizon of the setup. The same headline can support a short-term reaction and still fail as a multi-session trend if liquidity, policy expectations or broader sentiment move the other way.
Scenario map
The base case is that traders keep this theme on the radar while waiting for confirmation from supply headlines, inventory data, OPEC policy, transport routes and geopolitical risk. A stronger continuation scenario requires follow-through after the first reaction, preferably with related assets moving in the same direction. A failure scenario develops if the headline is quickly absorbed, volatility fades and price returns inside the previous range.
For energy markets, the most useful approach is to compare the article theme with live market behavior. If the market confirms the narrative, pullbacks can become more constructive. If the market rejects it, the headline becomes background noise rather than a trading driver.
Execution discipline
- Define the level first: traders should know where the idea is invalidated before thinking about upside or downside.
- Separate news from setup: WTI Crude Oil Technical Outlook: Identifying Key Price Trend Reversals may explain attention, but entry quality still depends on timing, liquidity and risk/reward.
- Watch confirmation: a clean move usually appears across related markets, not only in one isolated instrument.
- Control exposure: if volatility expands, smaller position sizing can be more professional than chasing the headline.
Next Move Markets treats this kind of brief as a starting point for preparation: identify the driver, map the scenarios, then wait for the market to prove which path is actually being priced.