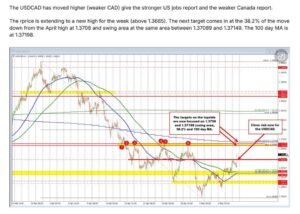
Soon after the better-than-expected US jobs report in the worse than expected Canadian jobs report, I posted the following brief commentary and chart:
The key resistance zone overhead was defined by the 38.2% retracement level, the swing area between 1.37089 and 1.37149, and the 100-day moving average near 1.3720. The price pushed higher into that resistance cluster, reaching a session high of 1.3710 before rotating back to the downside. The current price has now returned to the same area where the earlier post was made, reflecting the market’s inability to sustain momentum above the key technical ceiling.
On the downside, support now comes in near 1.3660. A move below that level would likely disappoint buyers and could lead to a deeper rotation lower, with traders then targeting the 200-hour and 100-hour moving averages near 1.3631 over time.
On a move back to the upside, buyers still need to break above the aforementioned resistance targets to regain more control from the sellers.
Since the beginning of April, sellers have largely dictated the price action. Although this week’s move above the 100-hour and 200-hour moving averages was a modest positive development for buyers, the more important hurdles remain the 38.2% retracement level and the 100-day moving average. A sustained move above those levels would be needed to shift the technical bias more firmly back in favor of the buyers.